Michigan Consumer Sentiment: October Preliminary
The October Preliminary came in at 81.2, up 0.8 from the September Final. Investing.com had forecast 80.5.
Surveys of Consumers chief economist, Richard Curtin, makes the following comments:
Slowing employment growth, the resurgence in covid-19 infections, and the absence of additional federal relief payments prompted consumers to become more concerned about the current economic conditions. Those concerns were largely offset by continued small gains in economic prospects for the year ahead. The Current Conditions Index recorded its second small reversal, the first being in June, but even at its best, it has never come close to its December peak, being still down by 26.5%. The Expectations Index, despite the recent gain, is still down by 14.4% from its February peak. How much has the presidential electioneering influenced this twist in consumer sentiment? Consumers were not asked whom they will or had voted for or their preference, but who they expected to win the election to determine the election's potential influence on economic expectations. Among all consumers, Biden's advantage in early October grew to 7 from 1 percentage point in the July to September surveys (see the chart). While self-identified Democrats and Republicans heavily favored the candidate from their own party, that proportion grew by 8 points among Democrats and shrunk by 5 percentage points among Republicans. Most elections are decided by those who are non-aligned with either party; the views of Independents remained unchanged and nearly equal, giving Trump a slight advantage of 2 or 3 points. When the difference in the Expectations Index was calculated by party identification, Trump still held an advantage over Biden with some interesting twists: Trump's advantage on the Expectations Index greatly narrowed among Republicans (from 31.1 in July to September to 13.9 in October) and only a slight narrowing among Democrats (from 4.0 to 1.6), but it widened among Independents (from 20.9 to 24.4). [More...]
See the chart below for a long-term perspective on this widely watched indicator. Recessions and real GDP are included to help us evaluate the correlation between the Michigan Consumer Sentiment Index and the broader economy.
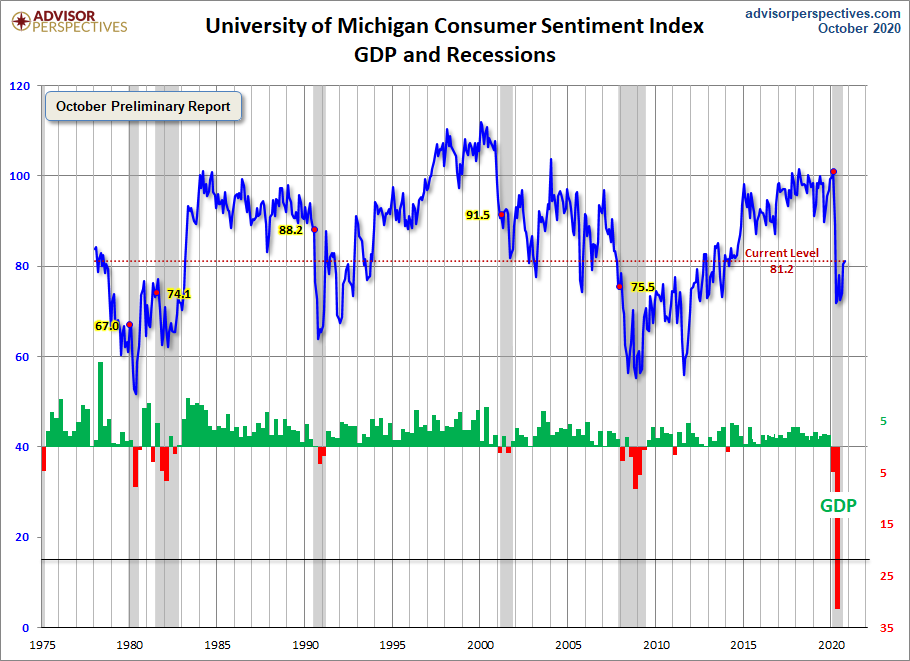
To put today's report into the larger historical context since its beginning in 1978, consumer sentiment is 5.8 percent below the average reading (arithmetic mean) and 4.7 percent below the geometric mean. The current index level is at the 32nd percentile of the 514 monthly data points in this series.
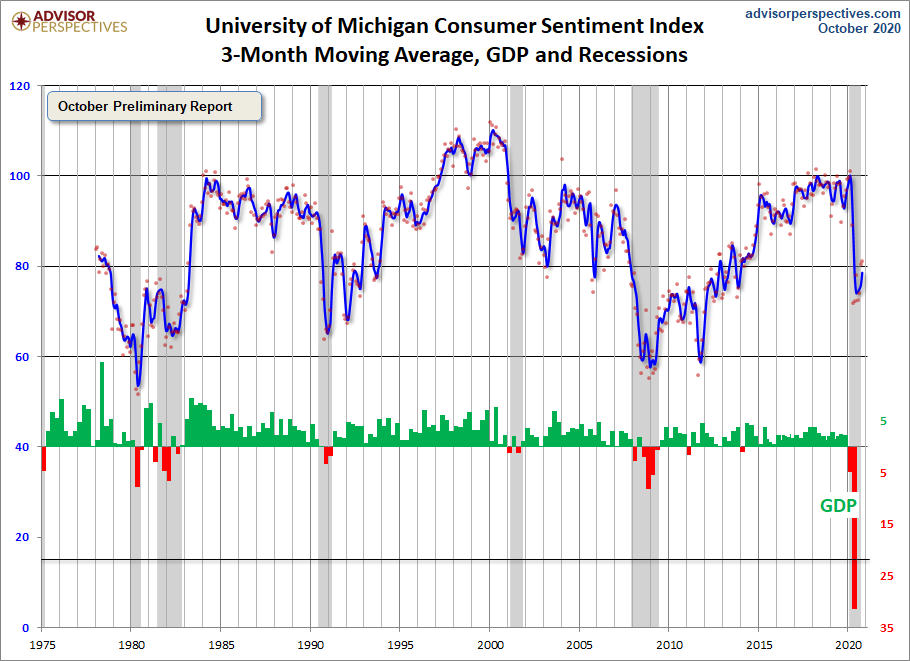
Note that this indicator is somewhat volatile, with a 3.0 point absolute average monthly change. The latest data point saw a 0.8 point increase from the previous month. For a visual sense of the volatility, here is a chart with the monthly data and a three-month moving average.
For the sake of comparison, here is a chart of the Conference Board's Consumer Confidence Index (monthly update here). The Conference Board Index is the more volatile of the two, but the broad pattern and general trends have been remarkably similar to the Michigan Index.

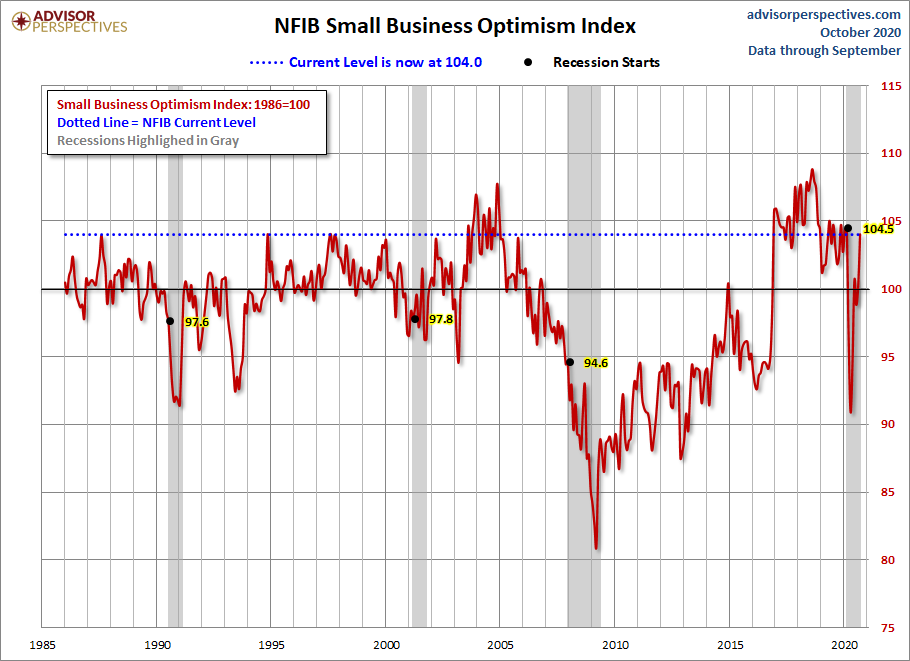
And finally, the prevailing mood of the Michigan survey is also similar to the mood of small business owners, as captured by the NFIB Business Optimism Index (monthly update here).