
Michigan Consumer Sentiment March Prelim Falls
The March Preliminary Report came in at 59.7, down 3.1 (4.9%) from the February Final. Investing.com had forecast 61.4. Since its beginning in 1978, consumer sentiment is 30.5 percent below the average reading (arithmetic mean) and 29.7 percent below the geometric mean.
Surveys of Consumers chief economist, Richard Curtin, makes the following comments:
Consumer Sentiment continued to decline due to falling inflation-adjusted incomes, recently accelerated by rising fuel prices as a result of the Russian invasion of Ukraine. The year-ahead expected inflation rate rose to its highest level since 1981, and expected gas prices posted their largest monthly upward surge in decades. Personal finances were expected to worsen in the year ahead by the largest proportion since the surveys started in the mid-1940s. Consumers held very negative prospects for the economy, with the sole exception of the job market. Consumers were slightly more likely to anticipate declines rather than increases in the national unemployment rate. This underlying strength in jobs comes at the cost of pushing inflation even higher due to unrelenting pressures on aggregate demand and supply lines. The persistent strength in demand was a critical factor that shaped the last inflationary age from 1965 to 1982, with stagflation peaking only near its end. Current expectations are consistent with heightened pressures on wages to meet the continued growth in demand. Like the game of musical chairs, everyone continues racing around the circle of rising prices and higher wages. Although everyone knows the game will end, everyone still wants to obtain the highest income possible before they exit. The game is moderated by fiscal and monetary policies, which now favor increased federal spending and full employment over price stability, enabling ever more rounds of the game. [More...]
See the chart below for a long-term perspective on this widely watched indicator. Recessions and real GDP are included to help us evaluate the correlation between the Michigan Consumer Sentiment Index and the broader economy.
(Click on image to enlarge)
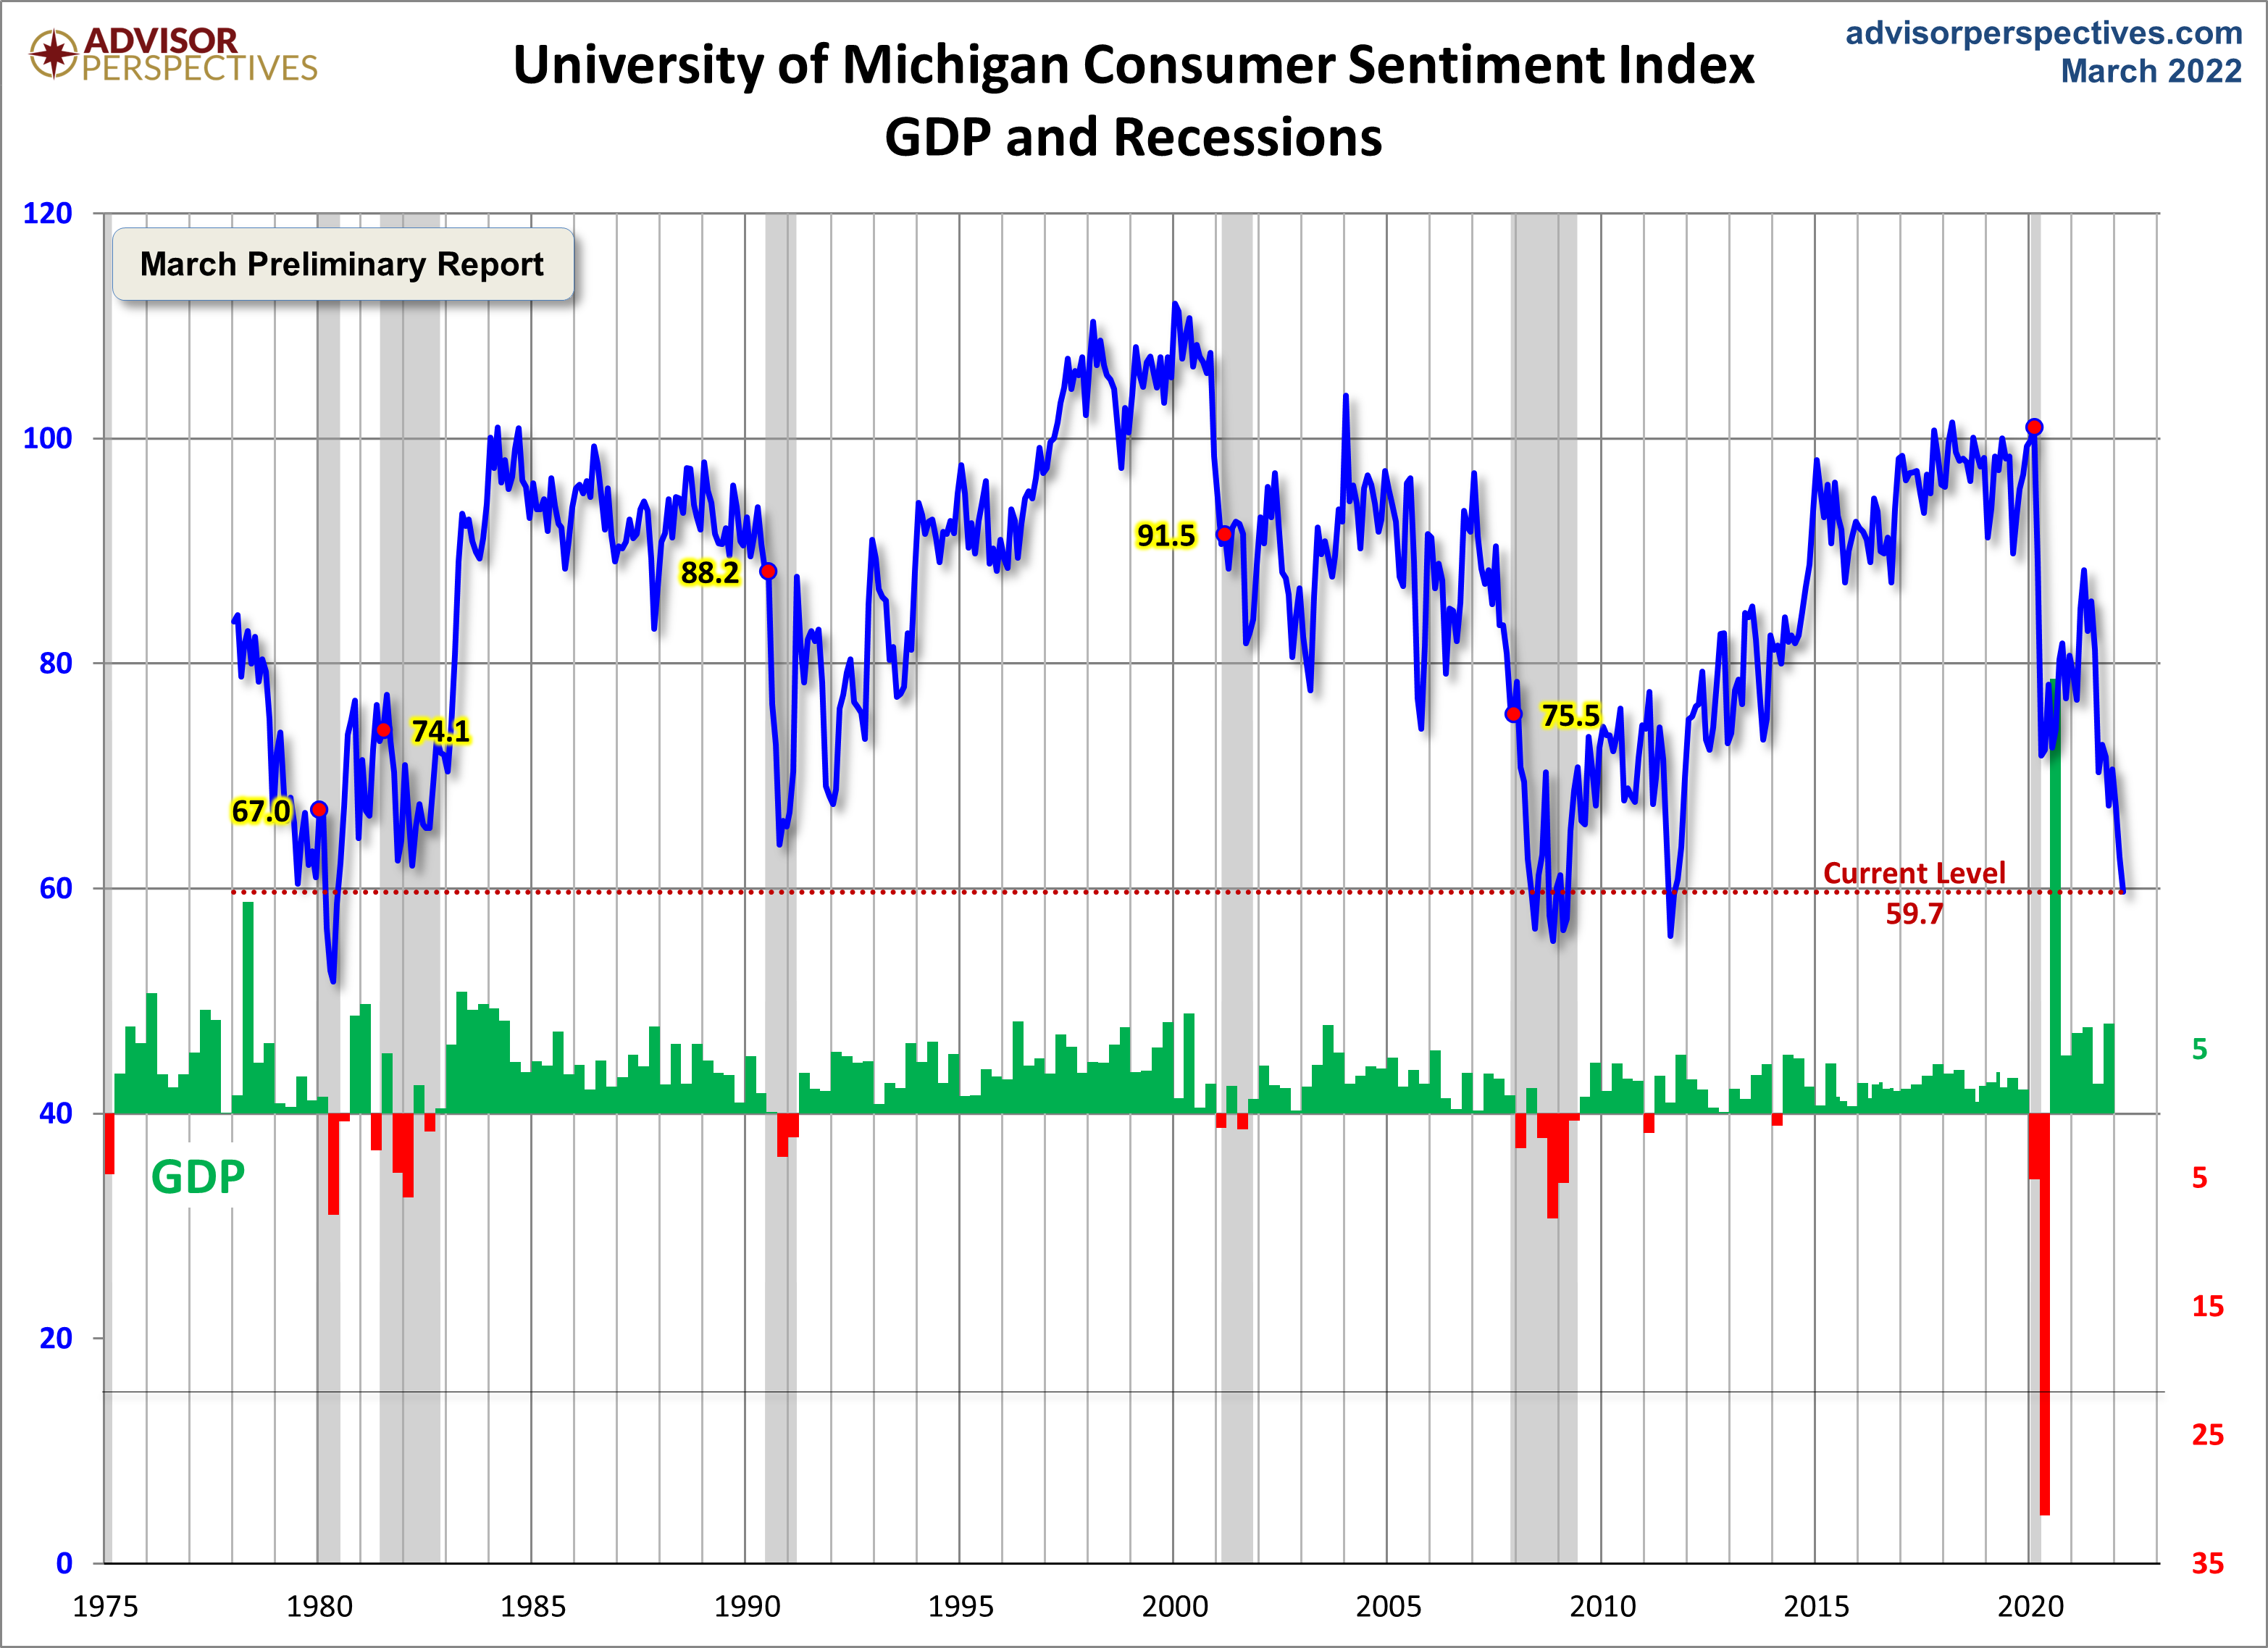
To put today's report into the larger historical context since its beginning in 1978, consumer sentiment is 30.5 percent below the average reading (arithmetic mean) and 29.7 percent below the geometric mean. The current index level is at the 2nd percentile of the 531 monthly data points in this series.
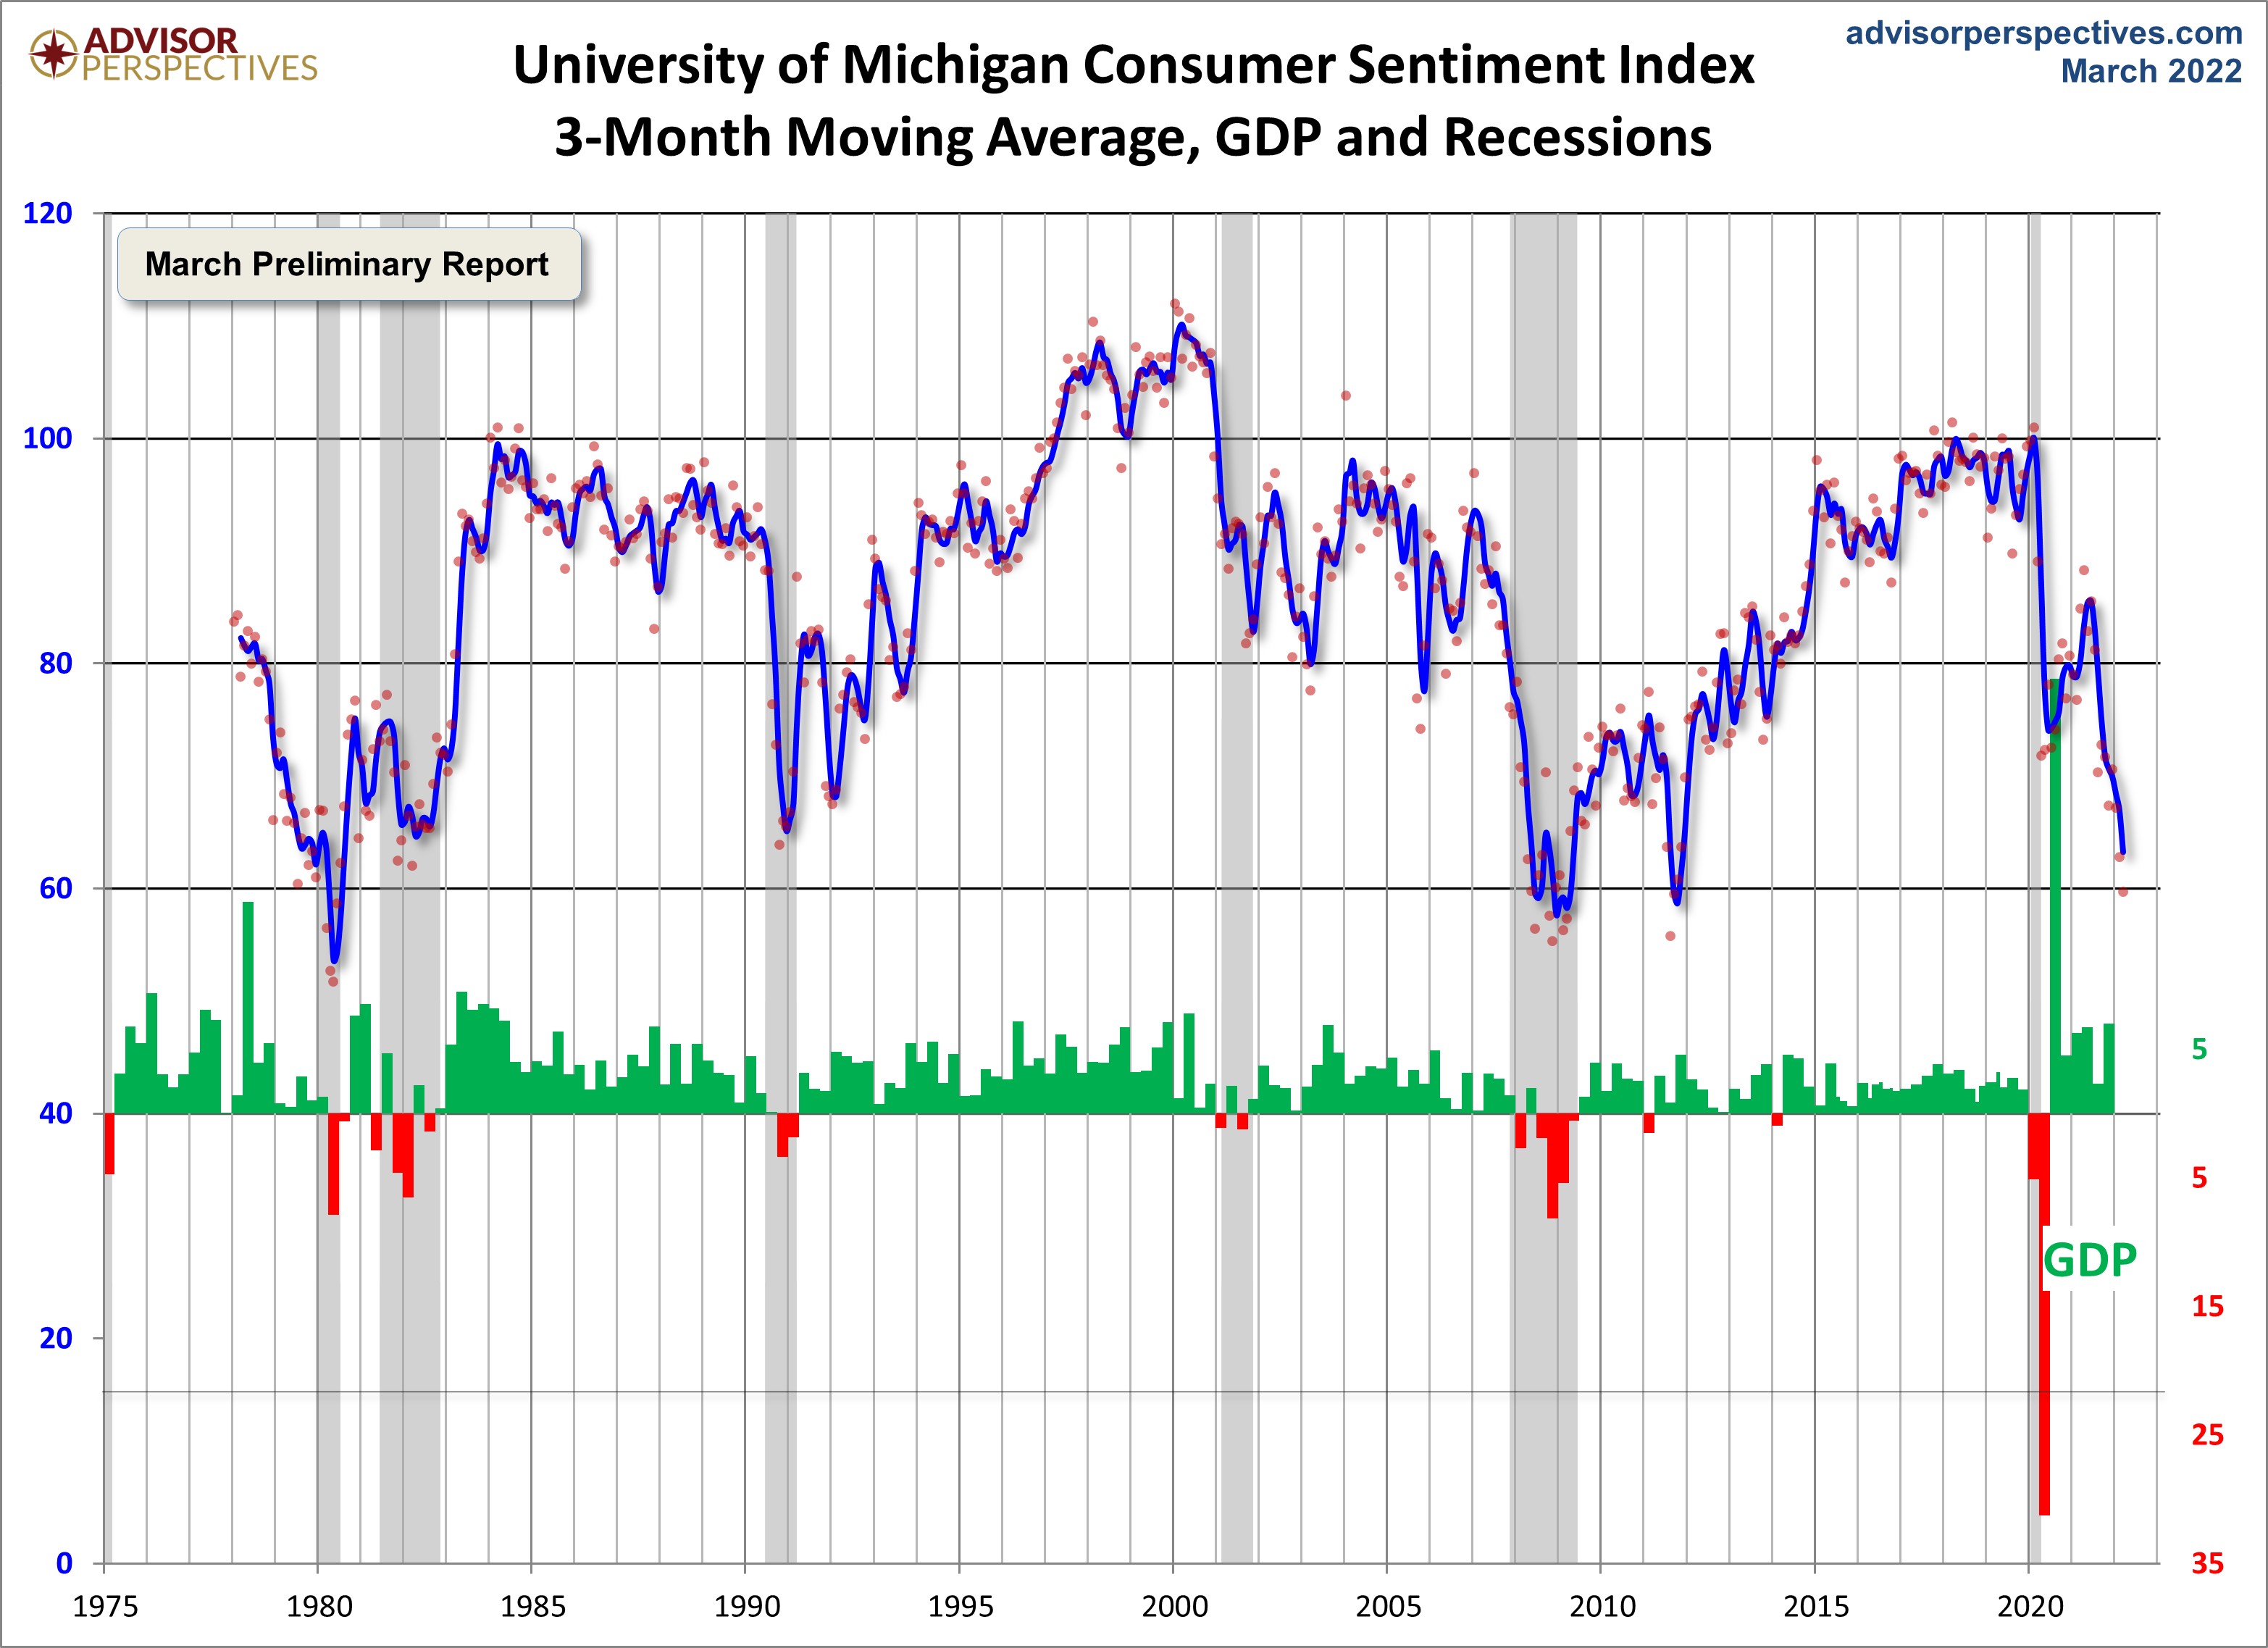
Note that this indicator is somewhat volatile, with a 3.0 point absolute average monthly change. The latest data point saw a 3.1 point decrease from the previous month. For a visual sense of the volatility, here is a chart with the monthly data and a three-month moving average.
(Click on image to enlarge)
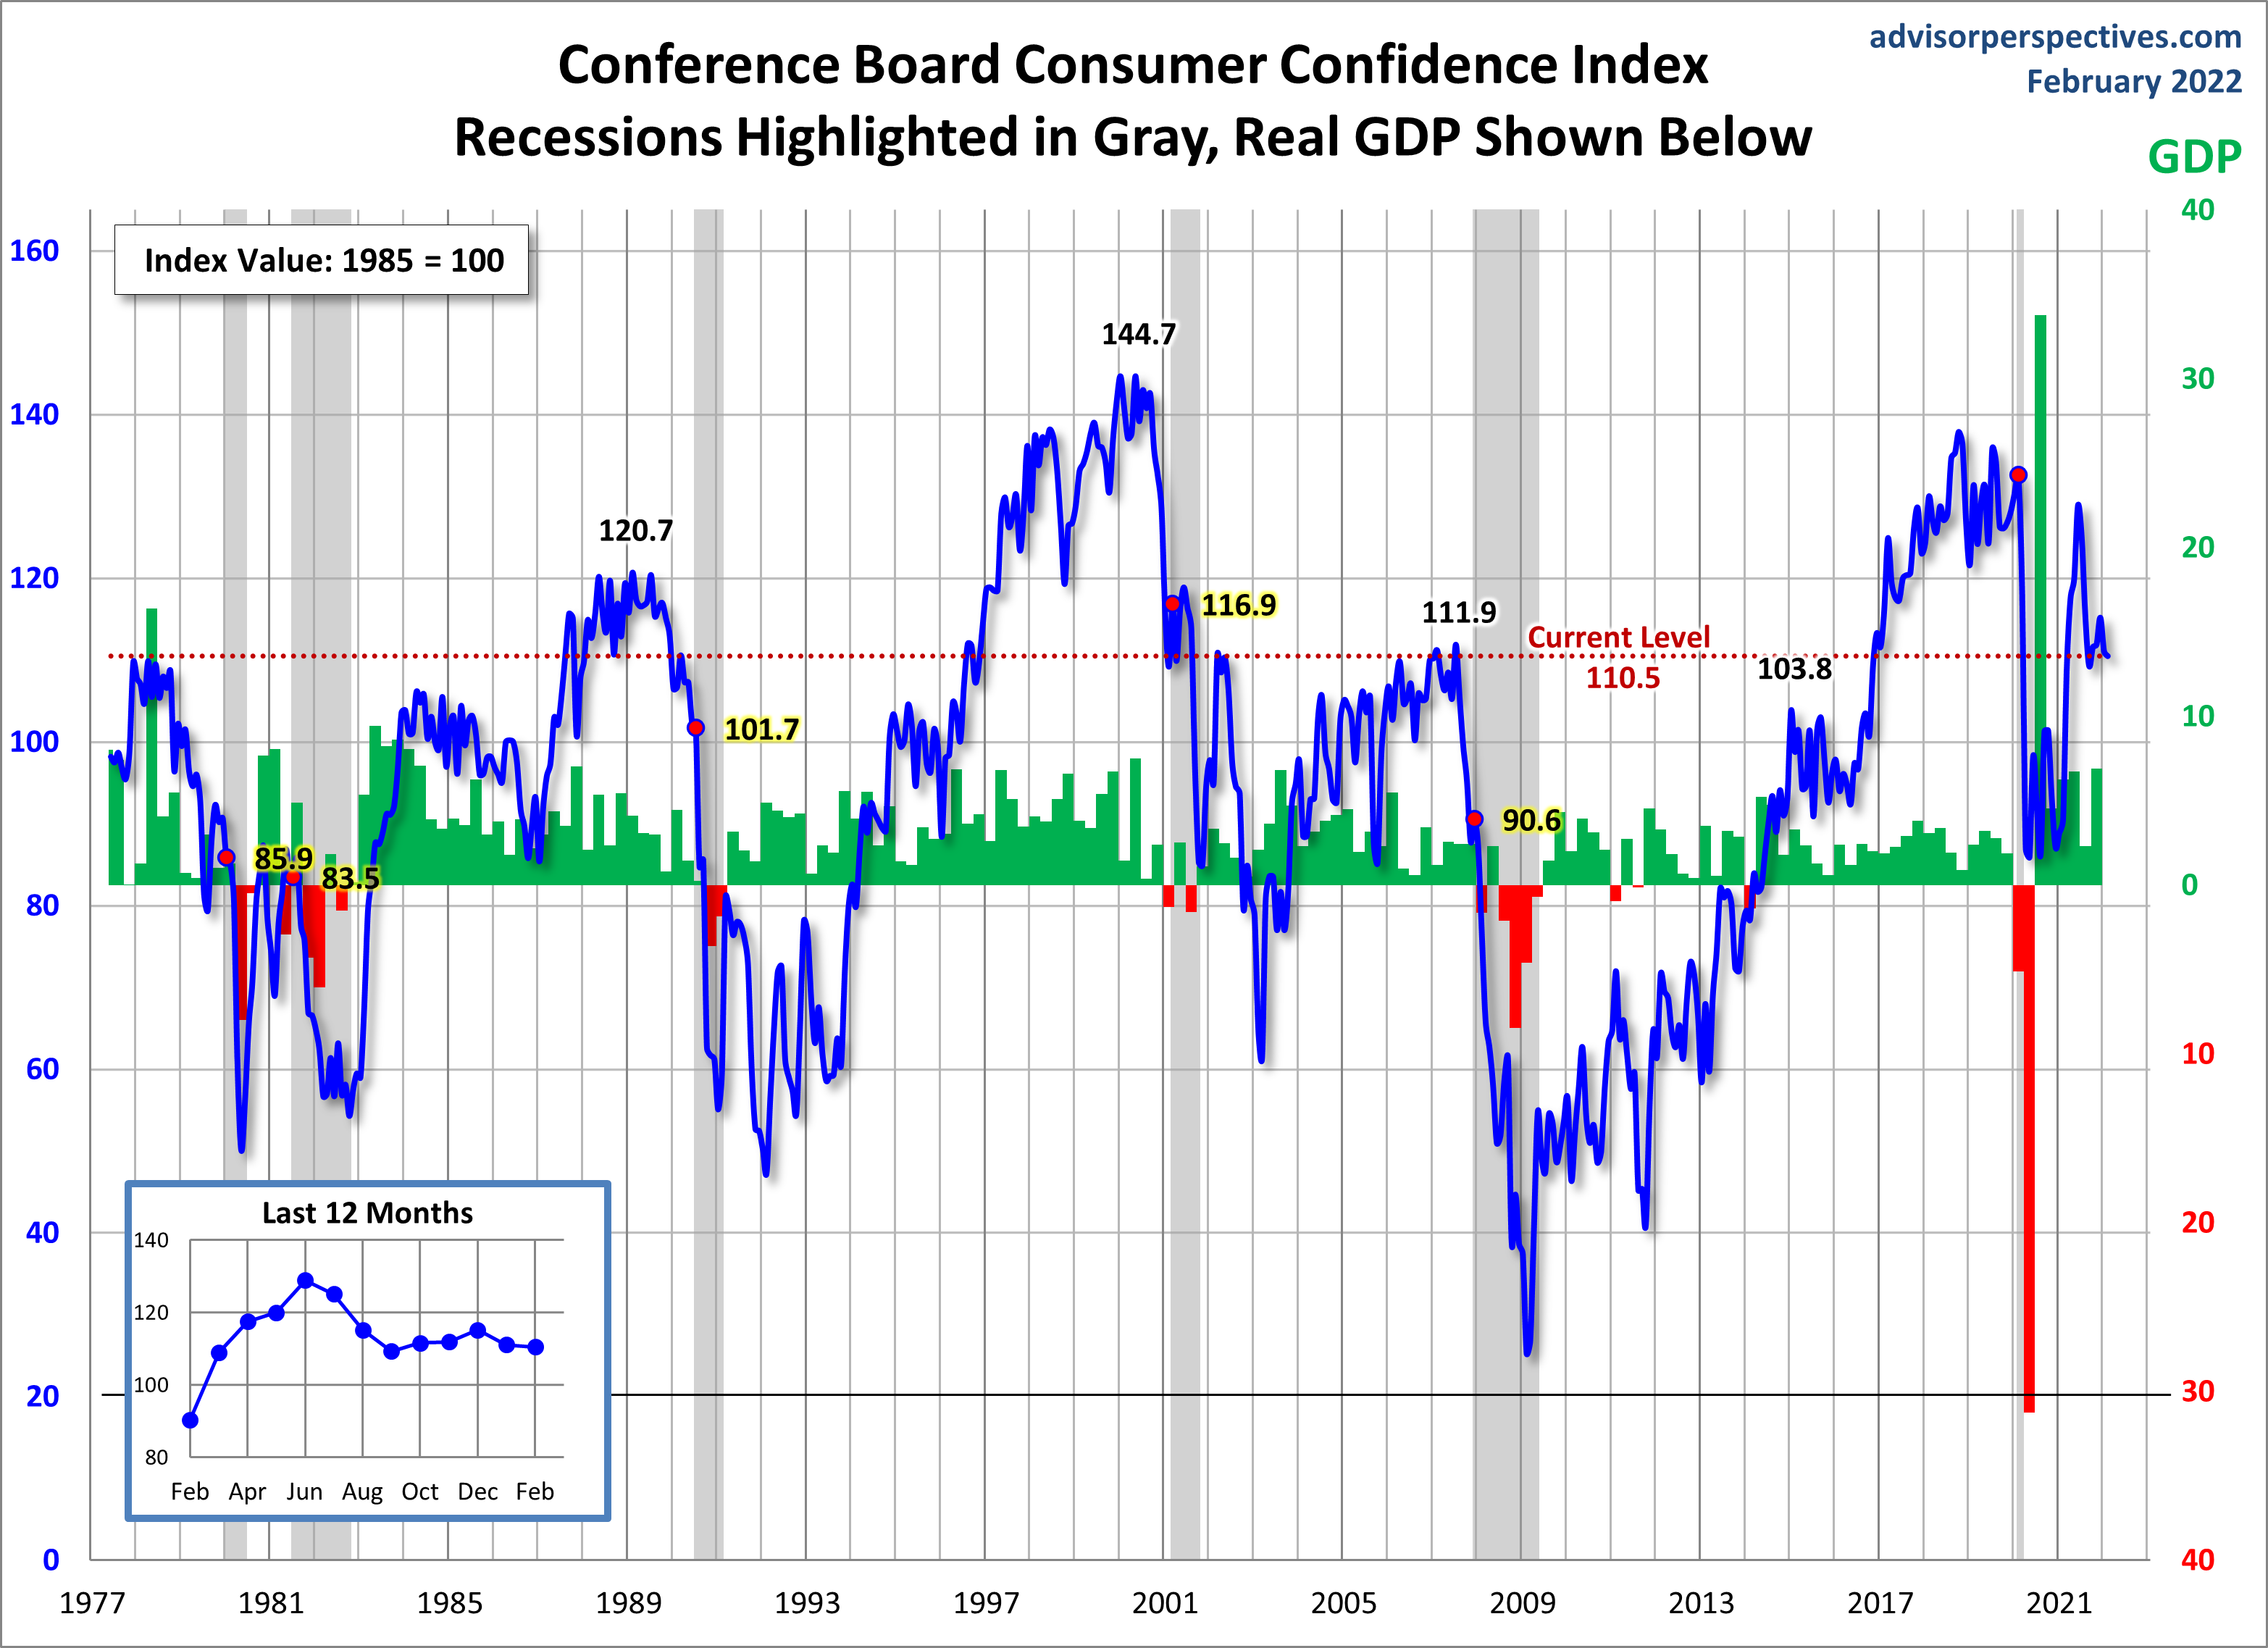
For the sake of comparison, here is a chart of the Conference Board's Consumer Confidence Index (monthly update here). The Conference Board Index is the more volatile of the two, but the broad pattern and general trends have been remarkably similar to the Michigan Index.
(Click on image to enlarge)
And finally, the prevailing mood of the Michigan survey is also similar to the mood of small business owners, as captured by the NFIB Business Optimism Index (monthly update here).


