
The July Final Report came in at 51.5, up 1.5 (3.0%) from the June Final. Investing.com had a forecast of 52.5. Since its beginning in 1978, consumer sentiment is 35.6 percent below the average reading (arithmetic mean) and 34.8 percent below the geometric mean.
Surveys of Consumers chief economist, Richard Curtin, makes the following comments:
Consumer sentiment moved up very slightly this month to about 5 index points above the all-time low reached in June. All components of the expectations index improved this month, particularly among low and middle income consumers for whom inflation is particularly salient. The year-ahead economic outlook rose substantially to just above its average reading from the second quarter 2022, while the two other expectations index components remain at or below their second quarter averages. At the same time, high income consumers, who generate a disproportionate share of spending, registered large declines in both their current personal finances as well as buying conditions for durables. With continued declines in energy prices, the median expected year-ahead inflation rate fell to 5.0%, its lowest reading since February but still well above the 4.6% reading from a year ago. At 3.0%, median long run inflation expectations remained within the 2.9-3.1% range seen over the past year. Uncertainty over long run inflation receded a bit, with the interquartile range in expectations falling from 4.7 last month to 3.8 this month, remaining above the 3.3 range seen last August. Still, the share of consumers blaming inflation for eroding their living standards remained near 48%. [More...]
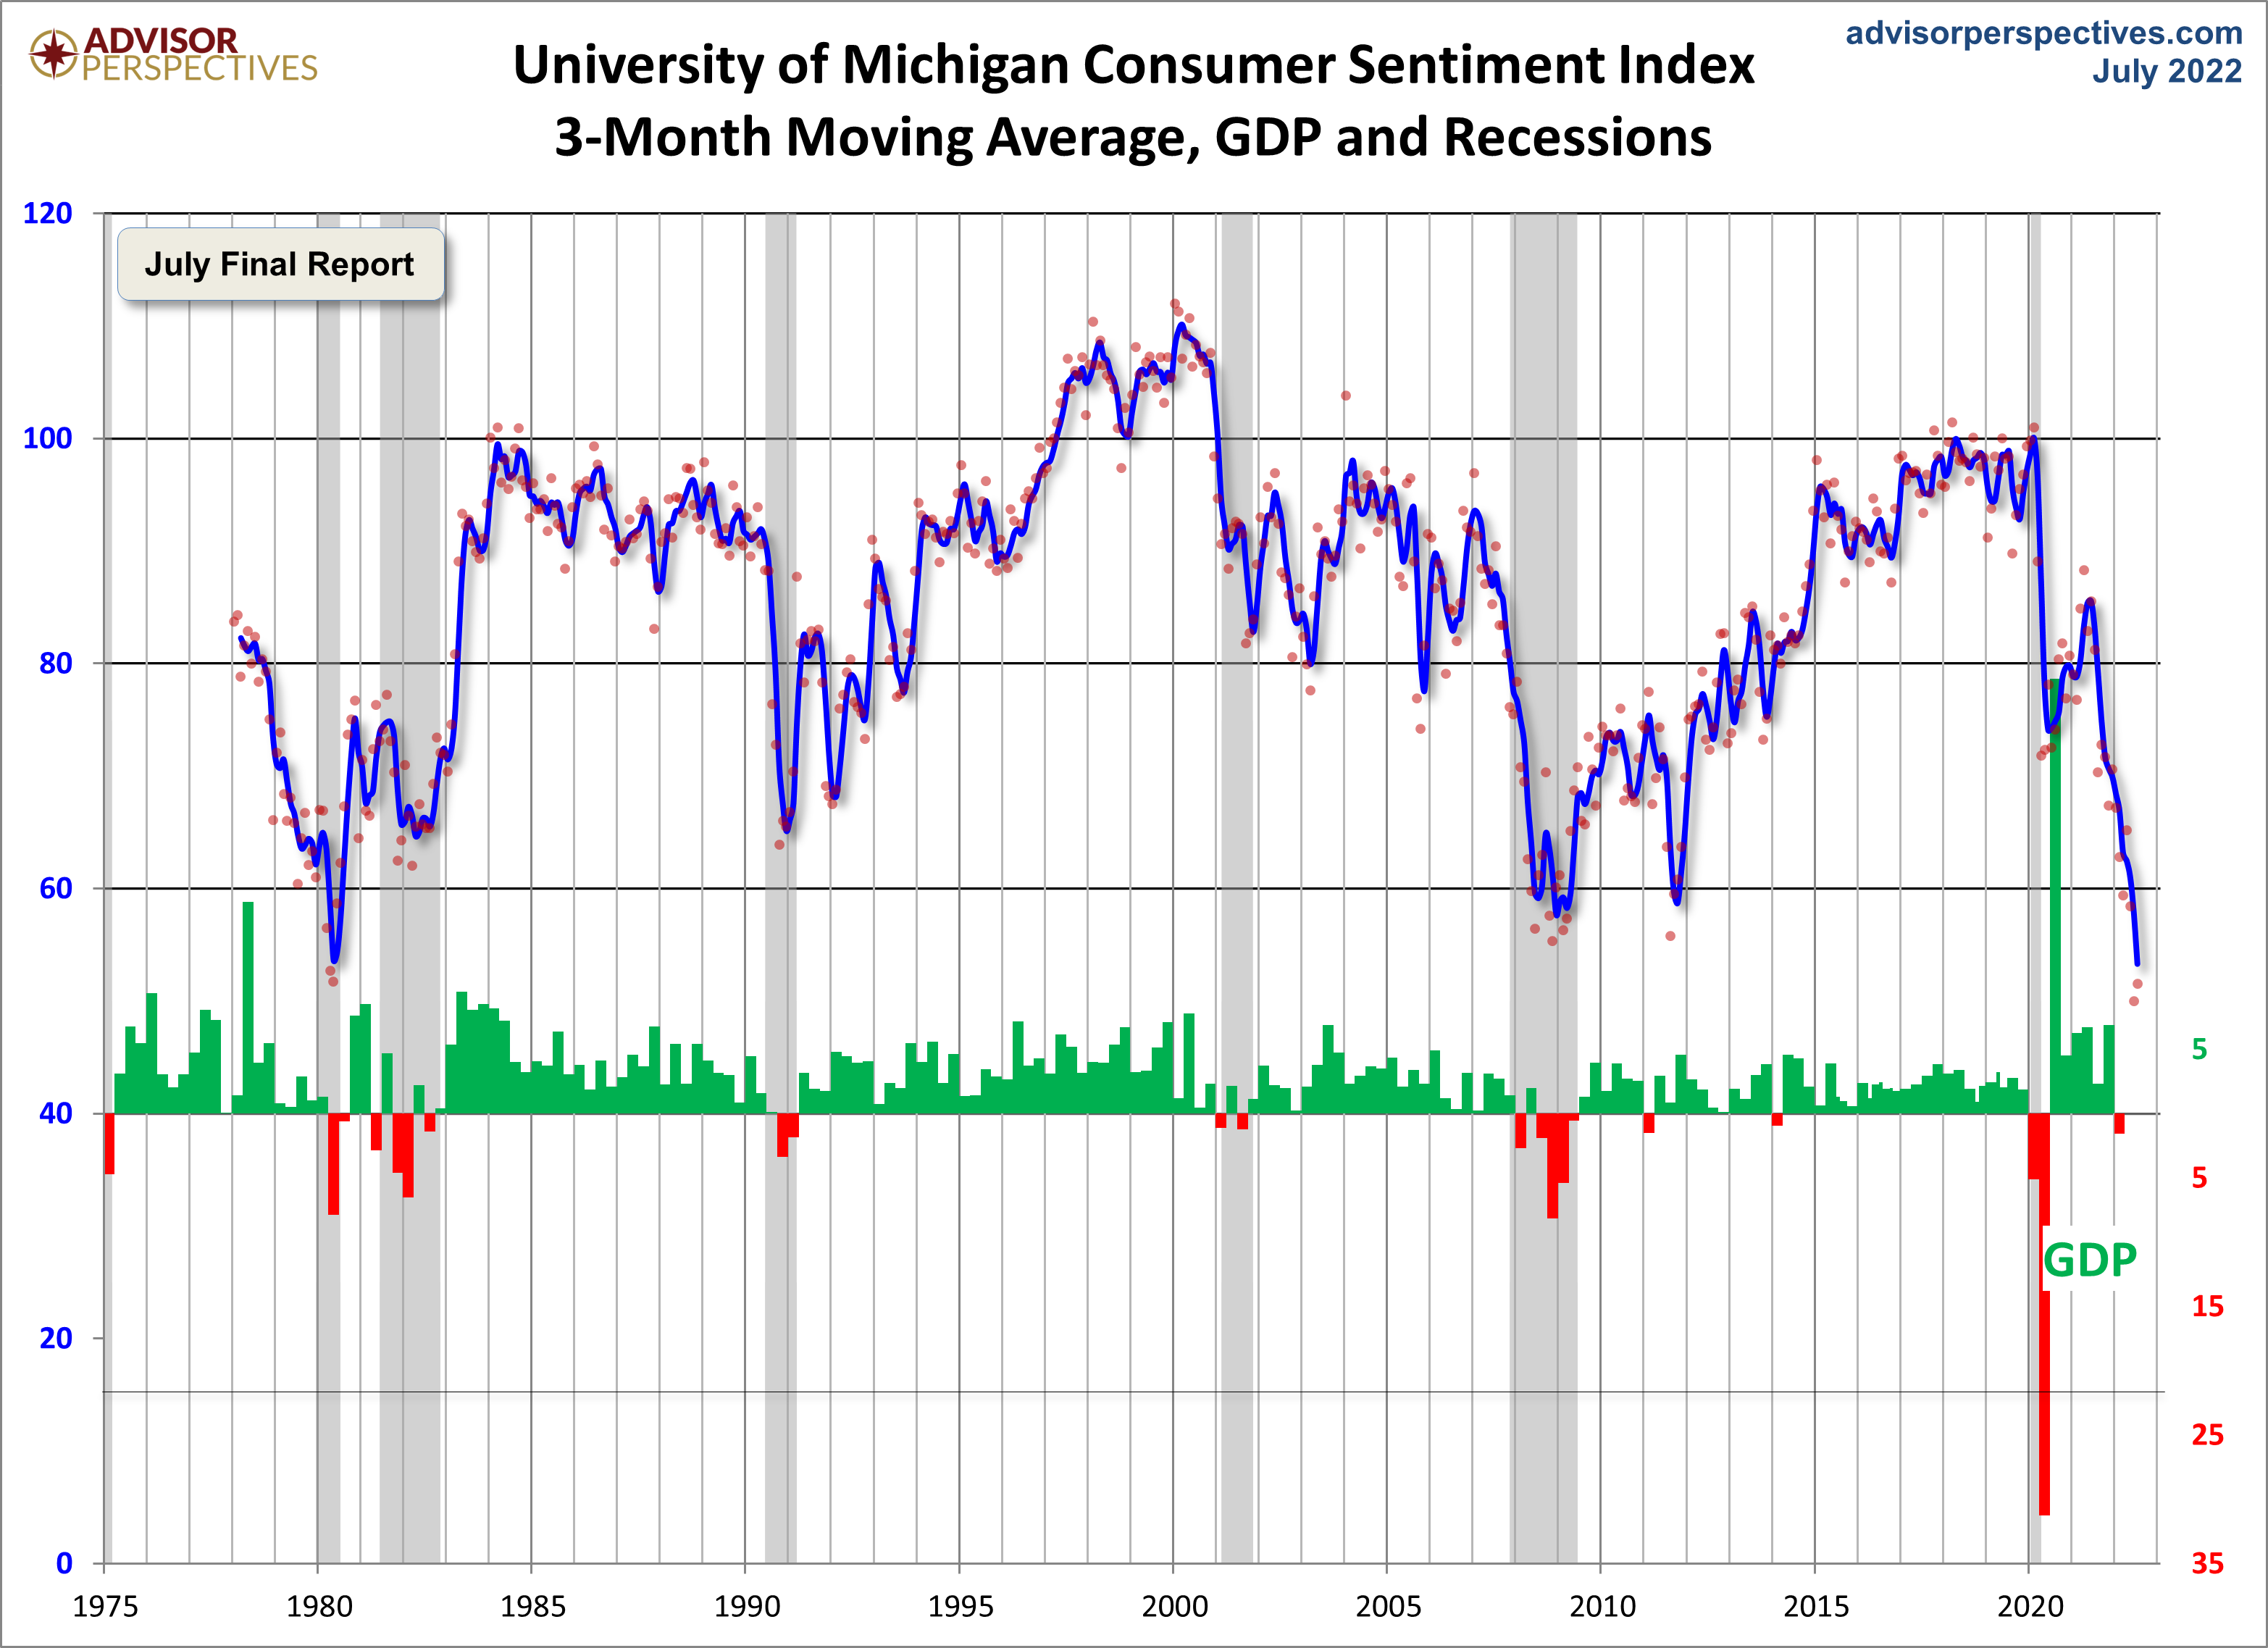
See the chart below for a long-term perspective on this widely watched indicator. Recessions and real GDP are included to help us evaluate the correlation between the Michigan Consumer Sentiment Index and the broader economy.

To put today's report into the larger historical context since its beginning in 1978, consumer sentiment is 35.6 percent below the average reading (arithmetic mean) and 34.8 percent below the geometric mean. The current index level is at the 0.7 percentile of the 536 monthly data points in this series.
Note that this indicator is somewhat volatile, with a 3.0 point absolute average monthly change. The latest data point saw a 3.6 point decrease from the previous month. For a visual sense of the volatility, here is a chart with the monthly data and a three-month moving average.
For the sake of comparison, here is a chart of the Conference Board's Consumer Confidence Index (monthly update here). The Conference Board Index is the more volatile of the two, but the broad pattern and general trends have been remarkably similar to the Michigan Index.

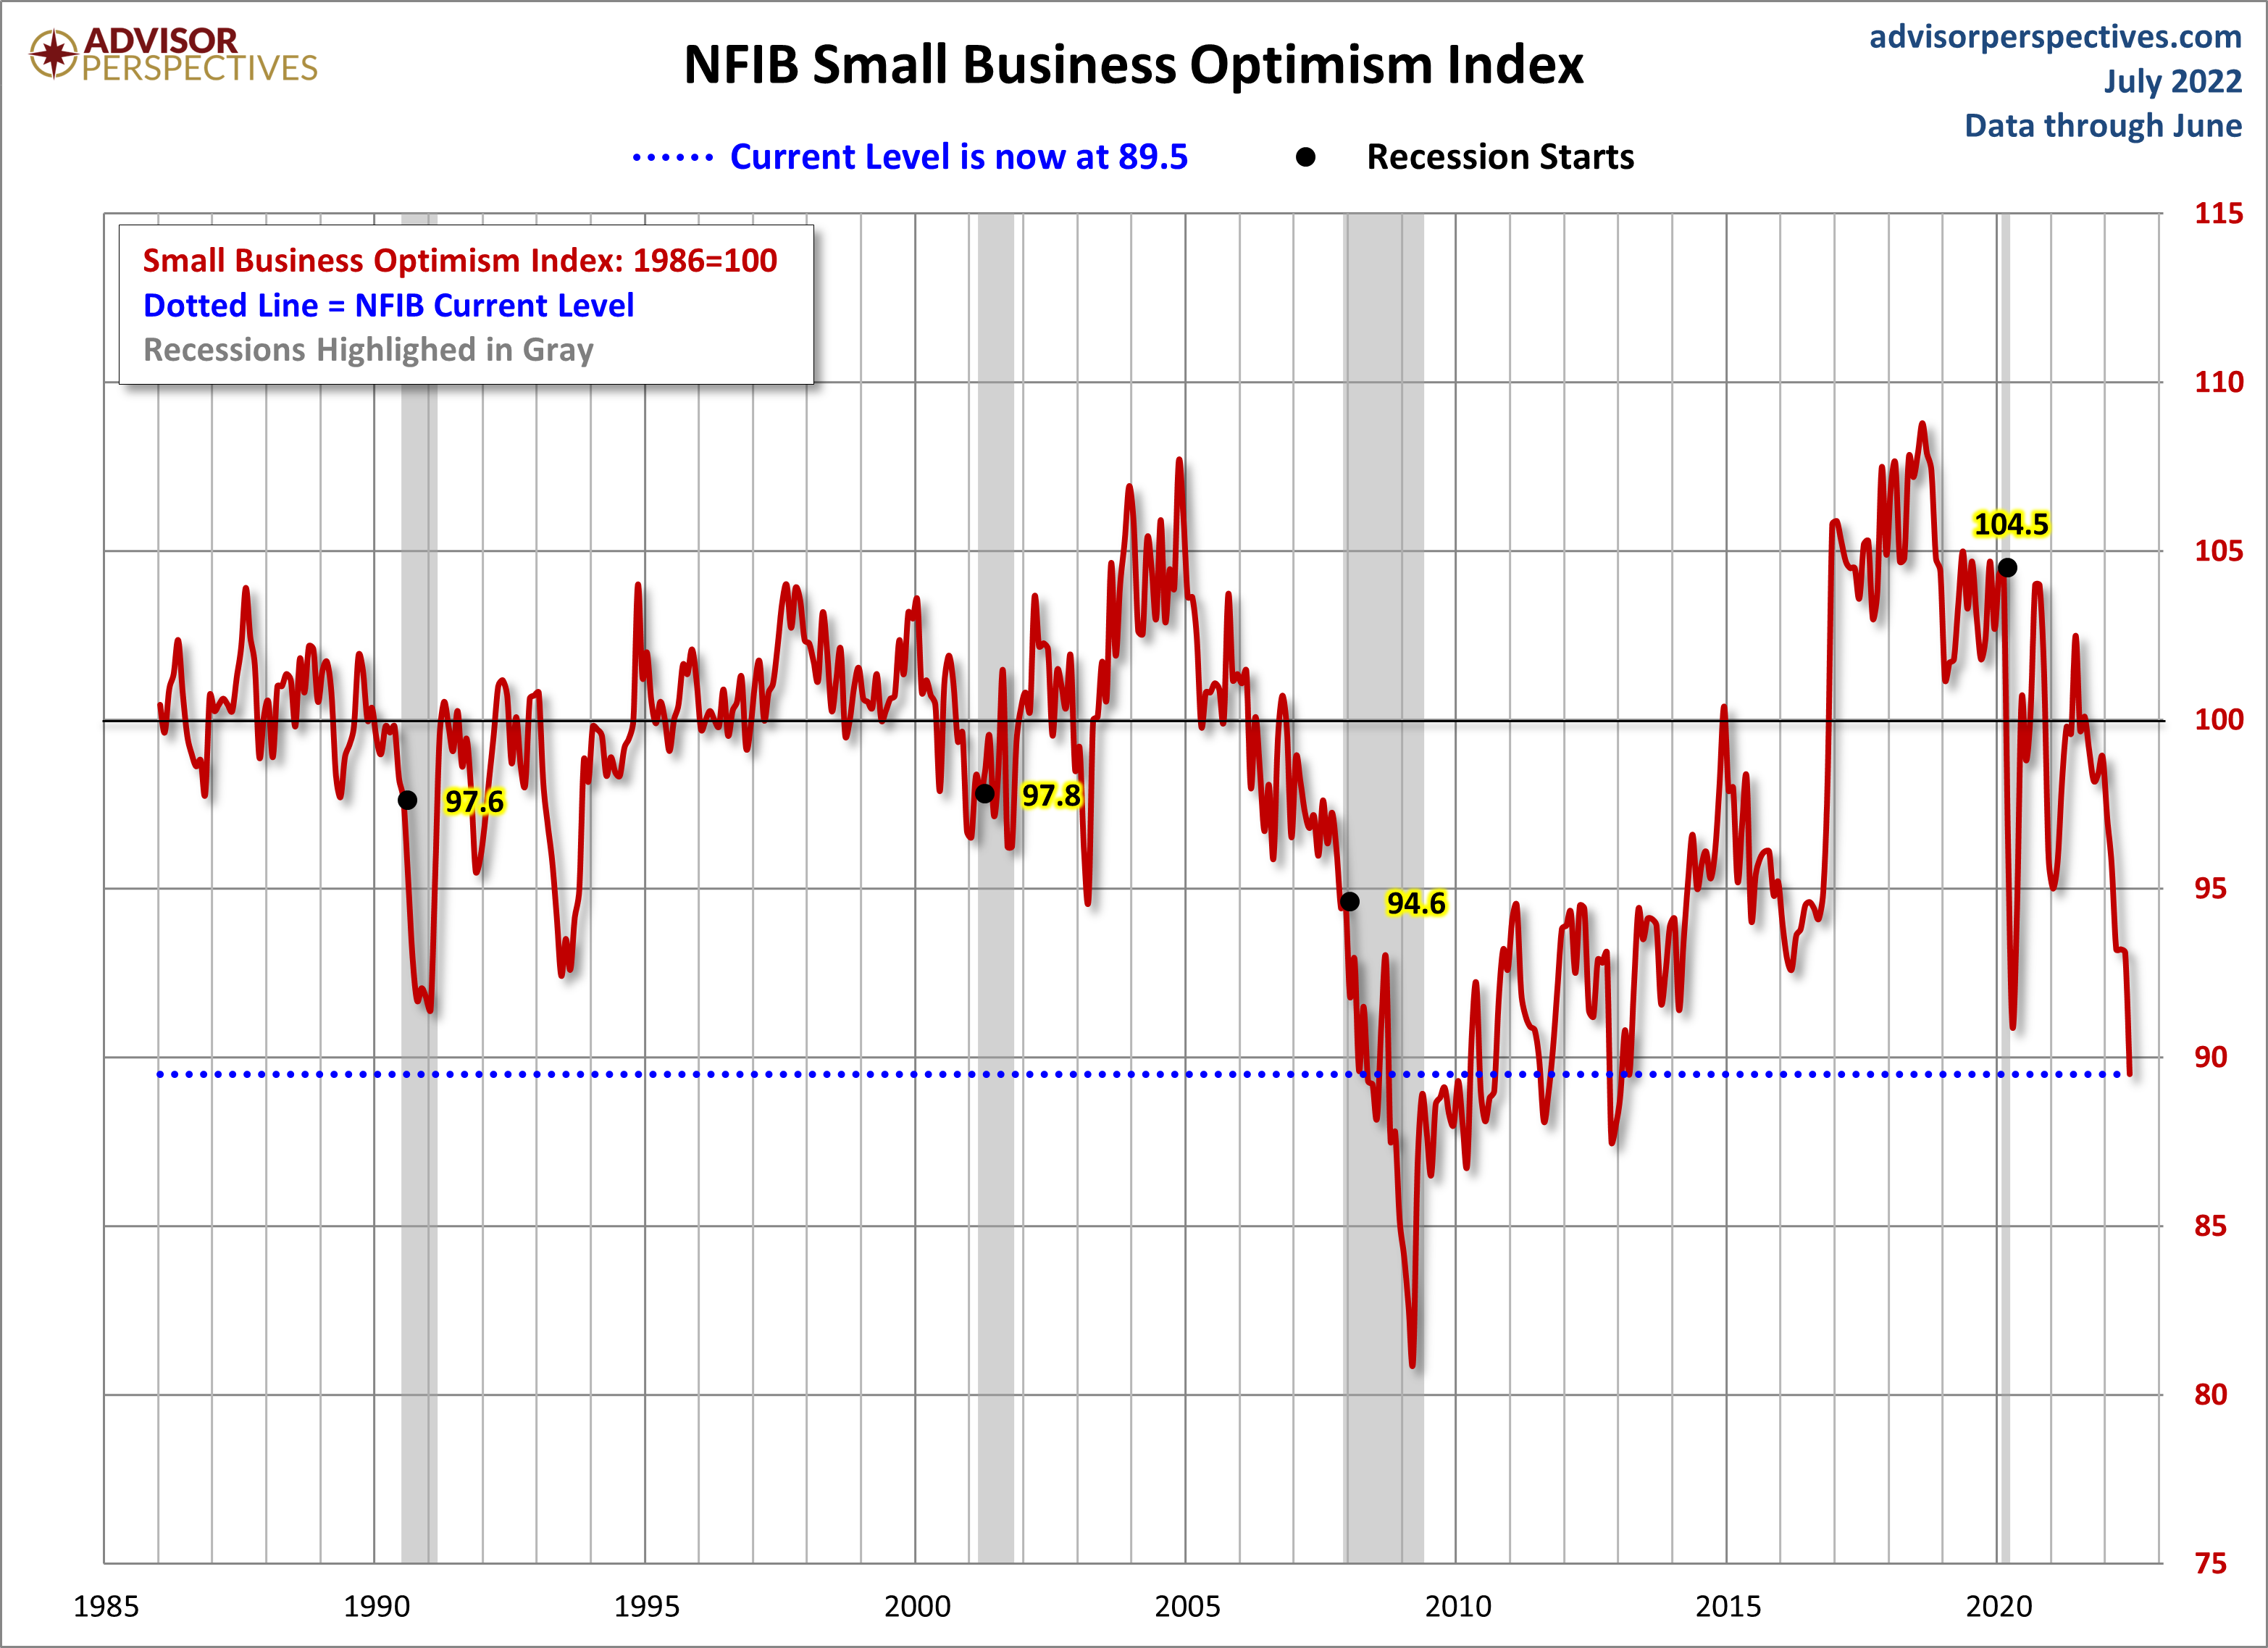
And finally, the prevailing mood of the Michigan survey is also similar to the mood of small business owners, as captured by the NFIB Business Optimism Index (monthly update here).
The next update to this report will be published on August 26.
More By This Author:
Empire State Mfg Survey: Activity Declined Sharply In AugustLong-Term Trends In Employment By Age Group - Aug. 12th Update
U.S. Workforce: July 2022 Update


Comments
Log in or sign up to join the conversation.