Median Household Income In October 2023
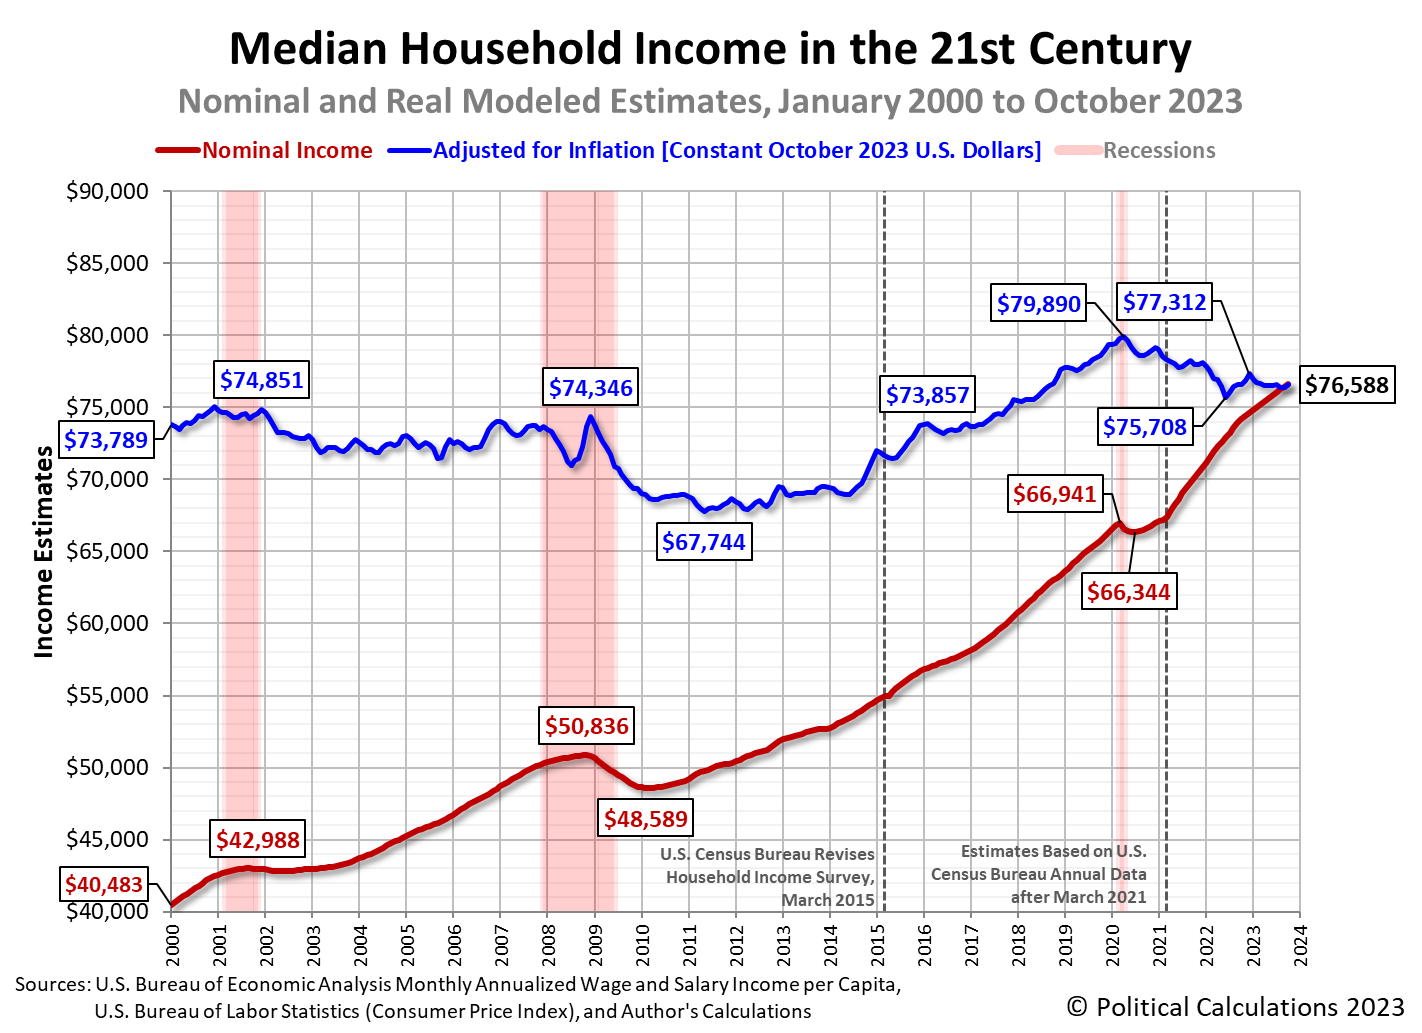
Political Calculations' initial estimate of median household income in October 2023 is $76,588, an increase of $206 (or 0.27%) from the corrected initial estimate of $76,382 in September 2023.
Thanks to the very slight dip in month-over-month inflation recorded in October 2023, the inflation-adjusted income of the typical American household rose by $211 in terms of constant October 2023 dollars.
The latest update to Political Calculations' chart tracking Median Household Income in the 21st Century shows the nominal (red) and inflation-adjusted (blue) trends for median household income in the United States from January 2000 through October 2023. The inflation-adjusted figures are presented in terms of constant October 2023 U.S. dollars.
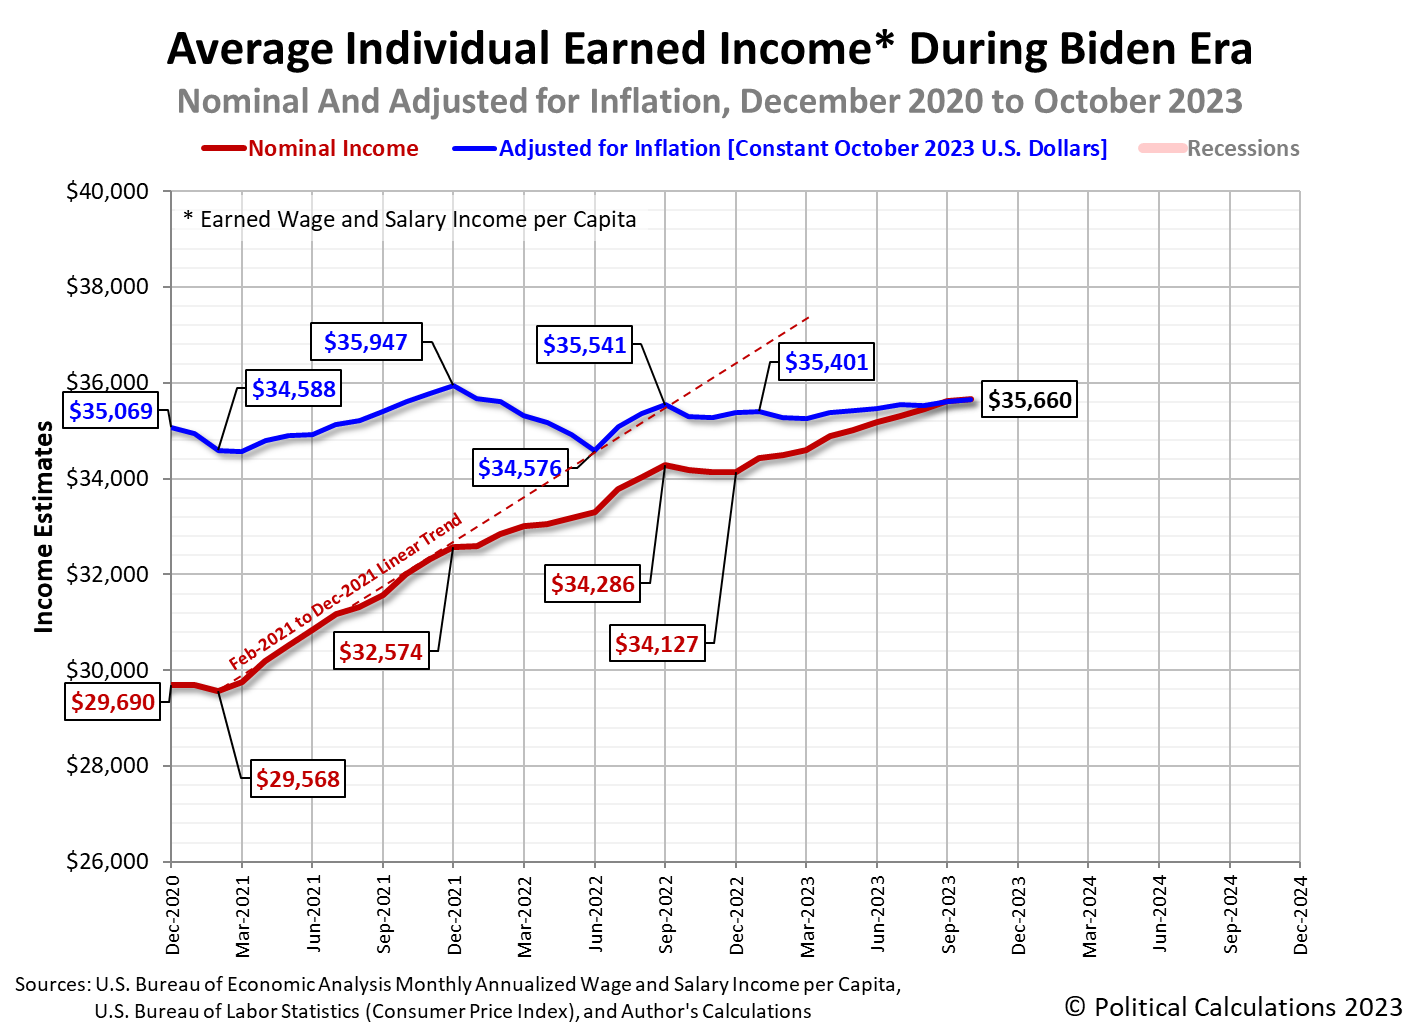
The average income earned by individuals from wages and salaries in October 2023 is $35,660. This per capita measure of income has grown slowly since December 2022 in nominal (non-inflation adjusted) terms. After adjusting for inflation, we find this measure of income remains well within the upper and lower limits of the range it has set since December 2020, as indicated in the next chart.
In terms of constant October 2023 U.S. dollars, this latter measure has risen by 0.3% since September 2022 but still remains below its December 2021 peak of $35,947.
Analyst's Notes
The Bureau of Economic Analysis reported small downward adjustments for its aggregate wage and salary income estimates for the months of April (-0.09%), May (-0.15%), June (-0.18%), July (-0.14%), August (-0.16%) and September 2023 (-0.01%).
As a point of comparison, the Atlanta Fed's most recent nominal estimate of median household income is $76,621, which applies for August 2023. Since December 2022, their model has indicated a faster rate of median household income growth than ours. The two sets of estimates are diverging slowly but are still within a half percent of one another through August 2023.
References
U.S. Bureau of Economic Analysis. Table 2.6. Personal Income and Its Disposition, Monthly, Personal Income and Outlays, Not Seasonally Adjusted, Monthly, Middle of Month. Population. [Online Database (via Federal Reserve Economic Data)]. Last Updated: 30 November 2023. Accessed: 30 November 2023.
U.S. Bureau of Economic Analysis. Table 2.6. Personal Income and Its Disposition, Monthly, Personal Income and Outlays, Not Seasonally Adjusted, Monthly, Middle of Month. Compensation of Employees, Received: Wage and Salary Disbursements. [Online Database (via Federal Reserve Economic Data)]. Last Updated: 30 November 2023. Accessed: 30 November 2023.
U.S. Department of Labor Bureau of Labor Statistics. Consumer Price Index, All Urban Consumers - (CPI-U), U.S. City Average, All Items, 1982-84=100. [Online Database (via Federal Reserve Economic Data)]. Last Updated: 14 November 2023. Accessed: 14 November 2023.
More By This Author:
New And Revised Data Suggests Possible Negative Change In Trend For U.S. New Home Market CapLess Than Useful Data: Inflation Indices
An Uneventful Thanksgiving Holiday Week For The S&P 500
Disclosure: Materials that are published by Political Calculations can provide visitors with free information and insights regarding the incentives created by the laws and policies described. ...
more


