Median Household Income In January 2022
Political Calculations' initial estimate of median household income in January 2022 is $74,099, an increase of $1,166 (or 1.6%) from the initial estimate of $72,933 in December 2022.
That sounds more impressive than it really was, however, because of substantial revisions to the income and population data that underlie the median household income estimates. With those revisions, December 2021's nominal median household income estimate was adjusted upward to $73,478, accounting for just over half of the difference from the initial estimate reported last month.
The latest update to Political Calculations' chart tracking Median Household Income in the 21st Century shows the nominal (red) and inflation-adjusted (blue) trends for median household income in the United States from January 2000 through January 2022. The inflation-adjusted figures are presented in terms of constant January 2022 U.S. dollars.
January 2022's estimated median household income of $74,099 is only $3 higher than December 2021's inflation-adjusted estimate of $74,096 in terms of constant January 2022 U.S. dollars. That compares with a non-inflation-adjusted increase of $545 from December 2021's nominal estimate of $73,478. That means 99.4% of the nominal month-over-month gain in median household income was eaten away by President Biden's inflation.
Analyst's Notes
The median household income estimates presented in this report were developed using the U.S. Census Bureau's definition of total money income. They do not incorporate unearned income sources such as those provided by the American Rescue Plan Act's stimulus checks and tax credits and are not affected by the expiration of these temporary programs at the end of 2021.
Substantial revisions were made to the underlying income and population data used to generate the estimates. The BEA adjusted its estimates of aggregate wage and salary income significantly upward in the period from July 2021 through December 2021, with the lowest adjustment in July 2021 (+0.17%) and the largest in December 2021 (+0.55%). In addition, the U.S. Census Bureau updated its resident population estimates from April 2010 (+10,000) through December 2021 (+745,000, about 0.22%).
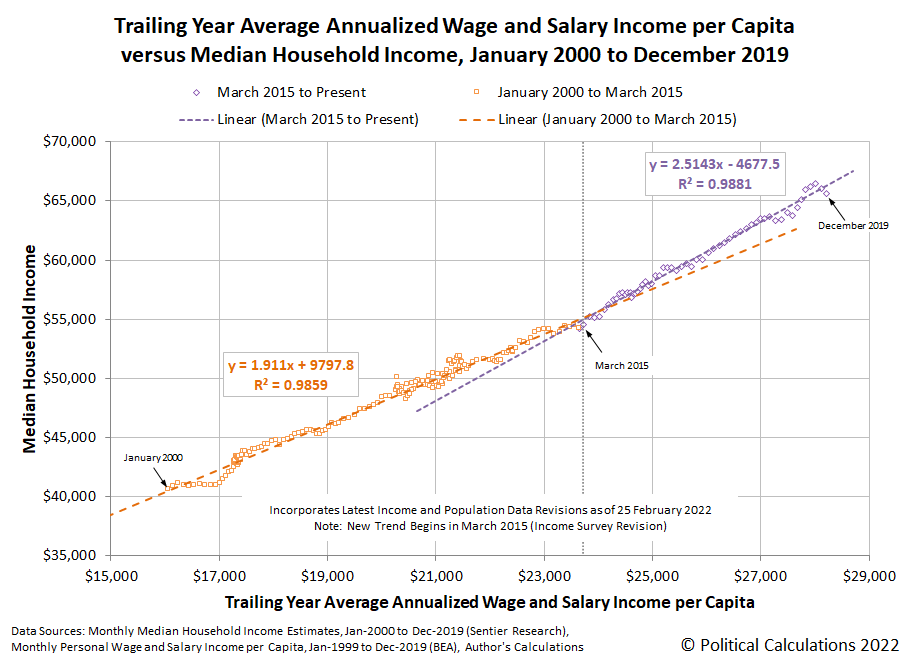
The next chart illustrates the resulting updated relationship between average annualized wage and salary income and median household income over the calibration period from January 2000 through December 2019.
Political Calculations' median household income estimates, represented by the dashed lines in this chart, were developed to reliably fall within a few percent of the Sentier Group's monthly estimates of median household income based on surveyed data collected through the U.S. Census Bureau's monthly Current Population Survey. Since the Sentier Group closed up shop after December 2019, Political Calculations has provided the most contemporary estimates of U.S. median household income available to the public. We'll feature a comparison of our estimates with those of our competitors in an upcoming separate analysis.
References
U.S. Bureau of Economic Analysis. Table 2.6. Personal Income and Its Disposition, Monthly, Personal Income and Outlays, Not Seasonally Adjusted, Monthly, Middle of Month. Population. [Online Database (via Federal Reserve Economic Data)]. Last Updated: 25 February 2022. Accessed: 25 February 2022.
U.S. Bureau of Economic Analysis. Table 2.6. Personal Income and Its Disposition, Monthly, Personal Income and Outlays, Not Seasonally Adjusted, Monthly, Middle of Month. Compensation of Employees, Received: Wage and Salary Disbursements. [Online Database (via Federal Reserve Economic Data)]. Last Updated: 25 February 2022. Accessed: 25 February 2022.
U.S. Department of Labor Bureau of Labor Statistics. Consumer Price Index, All Urban Consumers - (CPI-U), U.S. City Average, All Items, 1982-84=100. [Online Database (via Federal Reserve Economic Data)]. Last Updated: 10 February 2022. Accessed: 10 February 2022.
Disclosure: None.


