
Market Update - April 10, 2016
The warning did not come until Thursday, when price had several attempts to rally, but instead dropped to its previous low. Now after two failures, a third test of the lows would undoubtedly break support and send price in a precipitous decline.
S&P 500- 4 hour chart

Other clues came during the last 2-3 weeks of the advance, when price would accelerate to new highs, but after a few days a minor correction occurred. The pattern now has formed several mini peaks along the way, indicating momentum loss.
S&P 500- 4 hour (chart 2)
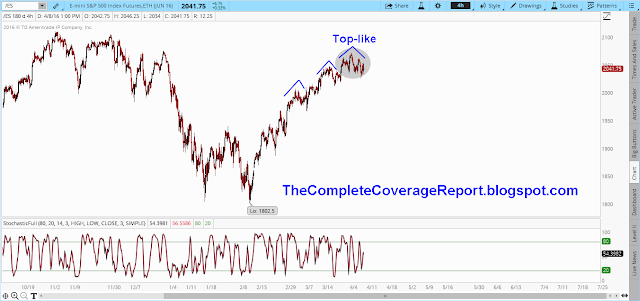
Technically, since we are still in an uptrend, there is the possibility of a final short-squeeze to higher highs. Anything upward of 20, even 50 points would theoretically take the S&P into May for a top. The result would be a divergent peak, indicating the rally is a bad one. It would also be the best scenario for the bulls - as price would form an even larger top, providing enough time for everyone to get out.In any case, whether we drop immediately, or continue on, the coming decline should lead to a 2-4 week sell off.
Stay tuned, more to come next week.
Diaclaimer:
My content is a matter of opinion provided for general information purposes only and is not intended as investment advice. Information and analysis above are derived from sources and ...
more

