Stock Market Bottom Or Bull Trap? Follow The Wyckoff Trading Method
An oversold rebound in S&P 500 unfolded last Friday, May 13 2022 as signaled by the market breadth. Find out how to use Wyckoff trading method to determine if this is a stock market bottom or a bull trap by focusing on the characteristics of the price action and the volume. Watch till the end of the video to find out the thought process and key levels that will violate the bearish scenario.
Video Length: 00:20:13
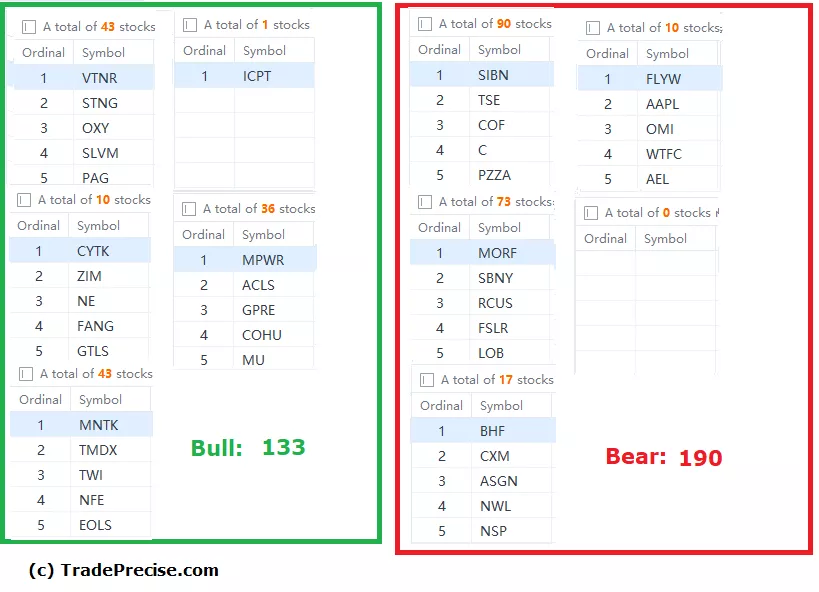
The bullish setup vs. bearish setup is 133 vs 190 from the screenshot of my stock screener below. This is a sharp reversal from last week (72 vs 923). The screener also reflects the sharp turning of the market breadth, which is constructive for the bulls.

Disclaimer: The information in this presentation is solely for educational purpose and should not be taken as investment advice.


Hi Ming,
Always nice to see new contributors at TalkMarkets. It would be good if you could provide an intro in each episode to let viewers know where you are going with your blog piece. Charts are good. Thanks.
Cheers Edward. That's a good idea. Incorporate the timeline (video chapter) within the video is something I wish to do for the convenience of viewers.
Good video, thanks for sharing.
You're welcomed. Glad you enjoyed :)