
Post-Brexit Decline Represents A Fantastic Buying Opportunity - Here's Why
I do not believe that the market will pivot higher and resume its uptrend on Monday; it could be weeks until the market develops a sustained uptrend. However, I believe that the post-Brexit decline represents a fantastic buying opportunity. Here's why.

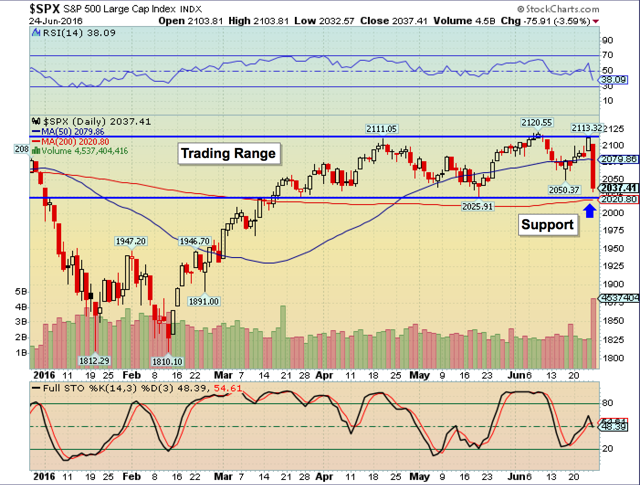
From a technical perspective, Friday's near 4% drop did not do too much damage. As I wrote previously, the decline brought the S&P back to where it was trading four weeks ago. The index is still caught in the same trading range in which it was trading more than three months ago.
Furthermore, the S&P remains above its 200 day moving average and the 50 day moving average is still well above the 200 day. This signals that the market's uptrend is still intact.
The Stochastics Oscillator and Relative Strength Index (RSI) are nearing oversold territory but have not crossed below 20 and 30, respectively. These readings imply that the market could see further downside before being viewed as oversold.
With that said, there is nearby support from the 200 day moving average (2020) and the bottom of the trading range (2025). This area of support is about .50-1% lower from where the S&P closed on Friday.
I would begin to be concerned if the market continues to tick lower through support and the Stochastics Oscillator and RSI remain oversold for an extended period of time. This is a sign of a broken market and a time during which many find themselves catching falling knives
(Click on image to enlarge)
It is uncommon for very large/volatile candlesticks to resolve themselves in just a few days. In other words, it takes the market time to digest large moves.
I do not believe that the market will pivot higher and resume its uptrend on Monday; it could be weeks until the market develops a sustained uptrend. However, I believe that the post-Brexit decline represents a fantastic buying opportunity.
Why? Take a look at the table below. It shows returns after the following parameters have been met. (Data in this study was analyzed from 1993 to 2016).
- The Volatility Index (VIX) spiked and closed higher by more than 50% from the close of a swing low.
- The S&P 500 is above its 200 day moving average.
| Stat | 5 Days | 1 Month | 3 Months | 6 Months |
| Mean | 0.88% | 2.70% | 4.84% | 7.45% |
| Median | 0.93% | 3.33% | 5.79% | 7.03% |
| # Pos | 21 | 24 | 24 | 26 |
| # Neg | 10 | 6 | 6 | 4 |
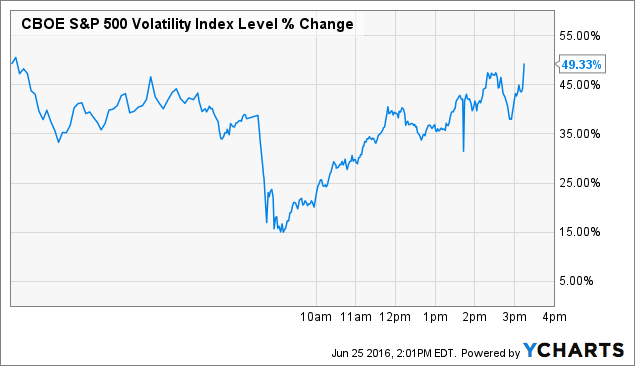
Below was the Volatility Index's price action on Friday. It was, well, volatile.
In a sentence, the study suggests that, as Warren Buffett has said, investors should, "[Be] greedy when others are fearful."
Again, I am not advising that one should buy Monday's open with the expectation of capturing a huge bounce. Rather, I suggest that over the coming weeks, as the market digests its large move downward, investors take the time to research high quality companies that suit their investing style. Odds are that the companies have considerably come off their highs.
This article may have been edited ([ ]), abridged (...) and/or reformatted (structure, title/subtitles, font) by the editorial team of munKNEE.com (Your Key to Making Money!) to provide a faster ...
more

