
Zcash: Triangle Consolidation Points To Wave 5 Breakout Toward 2018 Highs

Image Source: Pexels
Back on November 19, we discussed Zcash (ZECUSD) and its potential to push toward its 2018 highs. Since then, price has played out a corrective phase and found a base near the first projected $300 support level, in line with a completed ABC correction.
Zcash (ZECUSD) found a base at the first projected $300 support level, aligning well with the completion zone of a projected ABC corrective move. However, instead of a sharp rebound, price action has remained slow and largely sideways.
This behavior favors the interpretation that ZEC is forming a bullish ABCDE triangle pattern, which typically appears as wave 4 within a larger impulsive structure. The overlapping price action, compression in volatility, and inability of sellers to push price meaningfully lower all support this scenario.
(Click on image to enlarge)
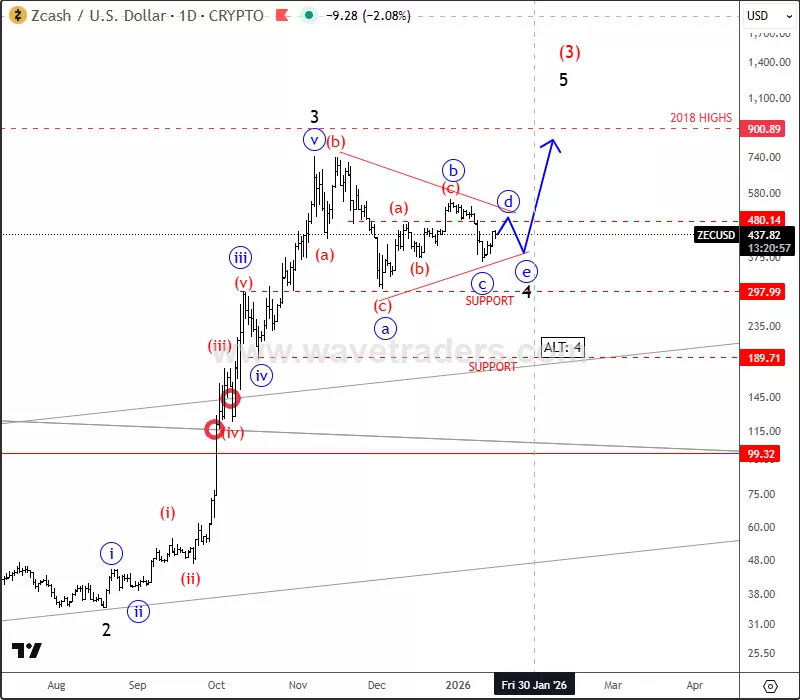
If this triangle structure completes as expected, the next move would be a bullish resumption in wave 5 of wave (3). Such a breakout would likely be impulsive and could open the path toward a retest of the 2018 highs, with the $1,000 area acting as a key long-term upside target. Alternatively, just be aware of a slightly deeper wave 4 correction with the next support around 200-180 area.
As long as price remains above the $300 base and continues to respect triangle boundaries, the higher-timeframe bullish structure remains intact.
More By This Author:
TRON Shows Bullish Recovery As Wave 5 Targets New Highs
Adobe: Bearish Structure Signals Final Leg Lower
Monero Breaks Into New All-Time Highs As Bullish Structure Points To Further Upside


