
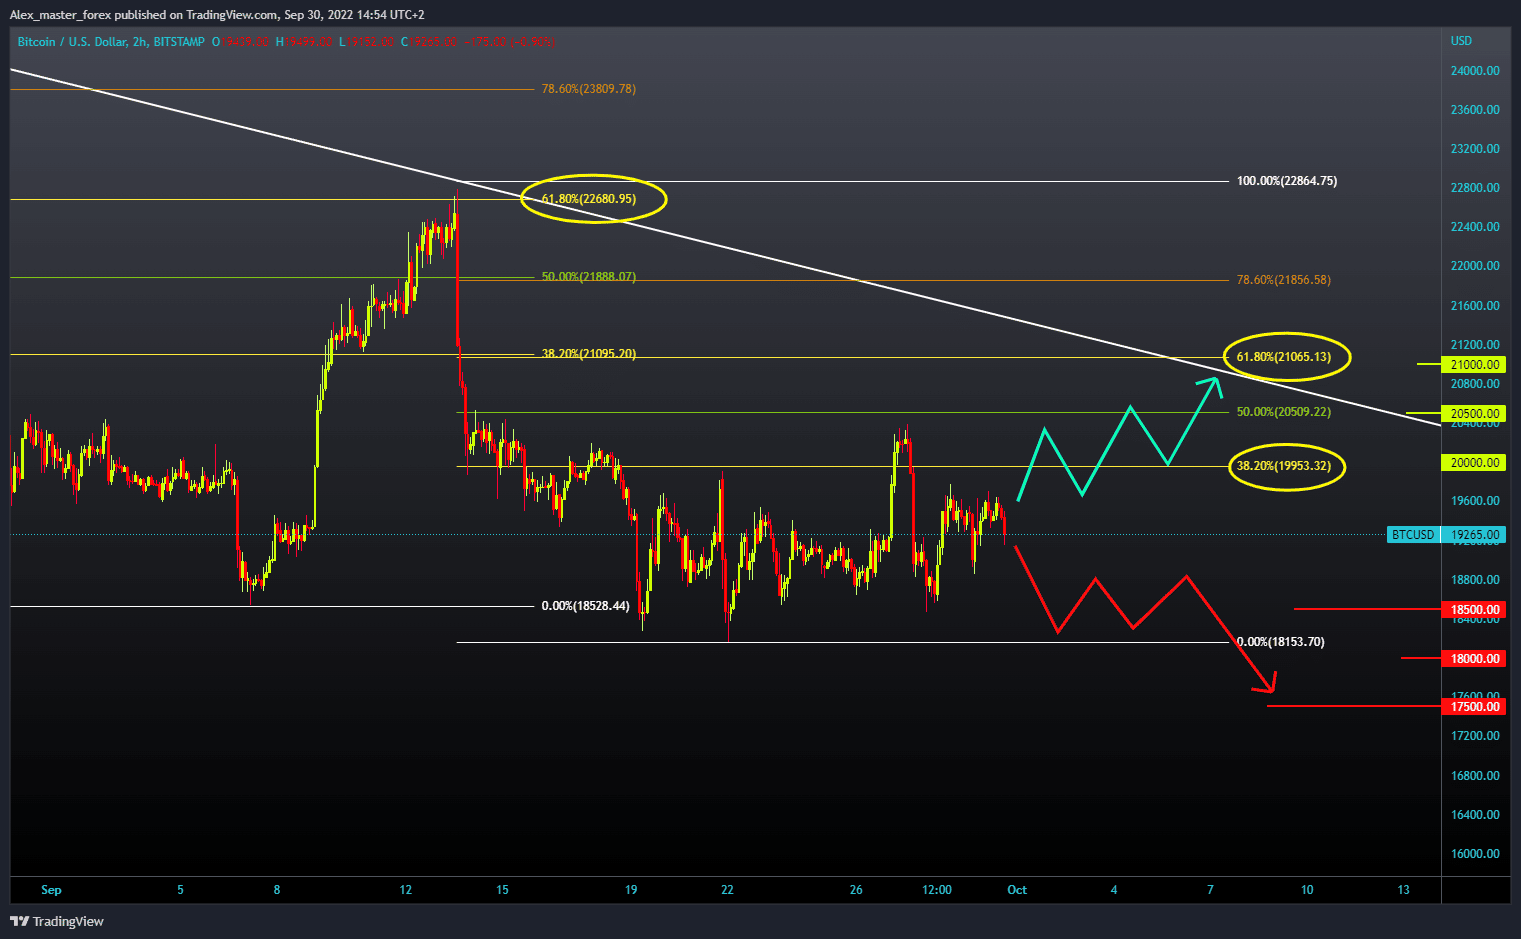
Bitcoin Chart Analysis
The price of bitcoin resumes its lateral movement without major oscillations. Today we were mostly at the $19600 level, and now we are currently leaning, and we could see a smaller pullback to the $19000 level. If the price pressure increases, we could find ourselves again in the support zone at the $18500 level. To continue on the bearish side, we need a negative consolidation. Further price decline could test $18150, our September low. In October, we could see a new lower low, and the potential targets are $17,500 and $17,000. For a bullish option, we need positive consolidation and price growth up to $20,000 at the 38.2% Fibonacci level. In the following, we need to stay above and continue the recovery with the new bullish consolidation. Potential higher targets are the 50.0% Fibonacci at $20,500 and the 61.8% Fibonacci at $21,000.
(Click on image to enlarge)
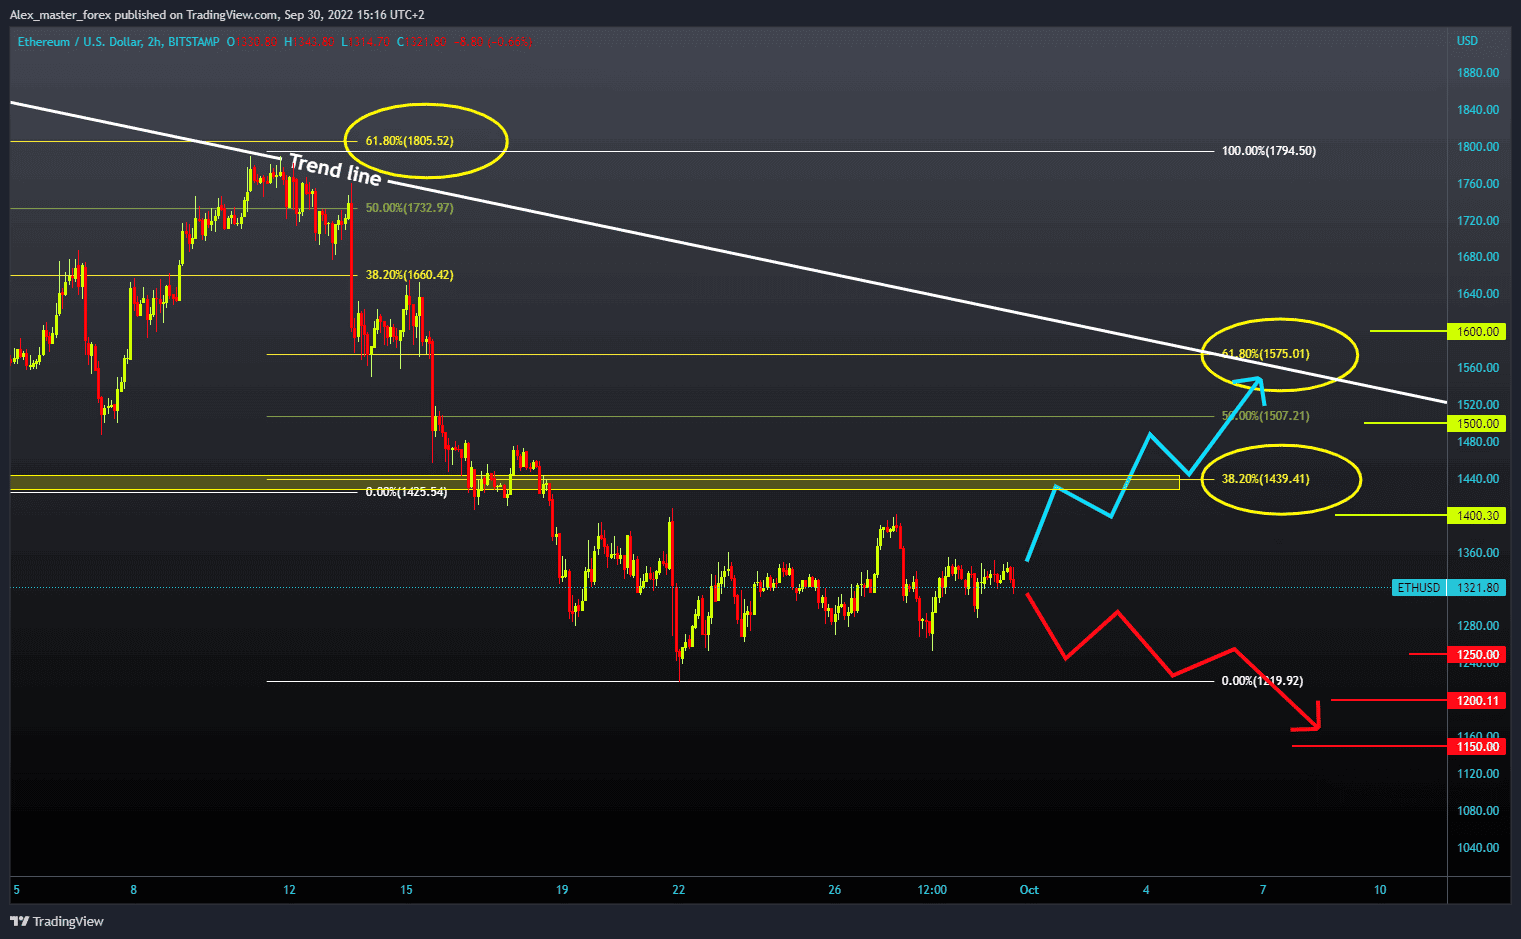
Ethereum Chart Analysis
Ethereum price is still in a sideways trend in the $1200-$1400 range. And today, we are in the middle of this channel at around $1300. For a bullish option, we need a positive consolidation and testing of the upper resistance at the $1400 level. Then we need a break above and try to stay up. Then we could continue the bullish trend first to 50.0% Fibonacci at the $1500 level, and the next target is 61.8% Fibonacci at $1575. An additional stop in that zone is the upper trend line. We need a negative consolidation to the lower support zone around the $1200 level for a bearish option. After that, we need a break below to continue to the bearish side. Potential lower targets are $1150 and $1100 levels.
(Click on image to enlarge)
More By This Author:
Gold and Silver: Week MaximumEuropean Stocks: Inflation Reaches 10% Record
Tether is having legal problems


Comments
Log in or sign up to join the conversation.