
Large-Cap Growth Leads US Equity Factors With Gain For 2020
Shares of growth stocks are in a class of their own this year after ticking into positive territory this week for year-to-date performance. The fractional gain through yesterday’s close (May 19) sets this corner of factor investing apart from the rest of the field, which remains in various degrees of loss so far in 2020, based on a set of exchange-traded funds.
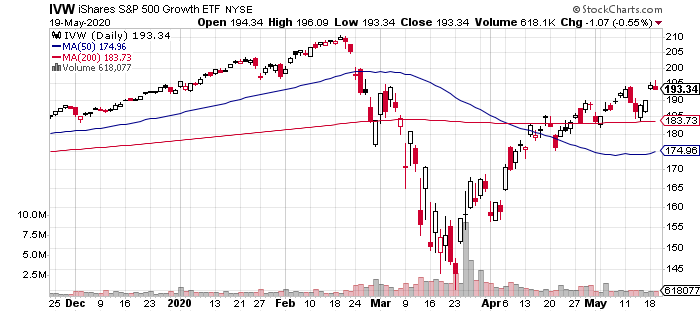
The iShares S&P 500 Growth (IVW) is currently the only year-to-date gainer, courtesy of a 0.2% rise. The slight increase contrasts with the other equity factor returns this year, which are uniformly negative for 2020’s scorecard.
IVW may be the poster boy for recovery this year, but there’s still room for debate as to whether this fund’s upside trend will continue or recent action is just the best of the bunch in a bear market rally.
What is clear is that growth (stocks expected to deliver relatively strong profit increases) continues to outperform value (inexpensively priced shares) by a wide margin. As The Wall Street Journal observes, “Shares of fast-growing companies are racing past their value counterparts, on pace to outperform the latter by the widest margin since the dot-com era.”
Indeed, the value factor continues to post the weakest results so far in 2020 and small-cap value is the weakest of the weak. The iShares S&P Small-Cap 600 Value (IJS) has lost a hefty 32.4% so far this year through yesterday’s close – a stark difference vs. IVW’s slight gain. Even the broad market’s year-to-date loss looks modest by comparison: SPDR S&P 500 (SPY) is down 8.7% so far in 2020.

For contrarian-minded investors, small-cap value’s weakness looks intriguing. Jeff Weniger, Wisdom Tree’s director of asset allocation, writes that growth’s hefty outperformance over small-cap value – this year and over longer trailing periods – suggests “it may be time to consider a generational move” that favors small-cap value allocations in some degree.
Perhaps, although small-cap’s downside momentum of late doesn’t inspire confidence that a turning point is near for this long-suffering corner.
Reviewing all the factor ETFs listed above through a momentum lens continues to show a deep level of bearishness. Note, however, that for the first time since the market correction began in March there’s a sign of life in the positive trend, albeit just barely. The momentum profile is based on two sets of moving averages. The first measure compares the 10-day average with its 100-day counterpart — a proxy for short-term trending behavior (red line in chart below). A second set of moving averages (50 and 200 days) represent an intermediate measure of the trend (blue line). Data through yesterday’s close shows that short momentum (red line) has rebounded a bit in recent days after staying glued to a maximum bearish position for weeks.

Disclosure: None.


