Kaspa Found Support At The Blue Box Area
Kaspa is a proof-of-work (PoW) blockchain that implements the GHOSTDAG protocol with rapid block processing and minimal confirmation durations. It’s ative cryptocurrency KAS is used for on-chain transactions and mining rewards. In today’s video bog, we’ll explore Elliott Wave pattern taking place within the short term cycle and explain the potential path based on the theory.
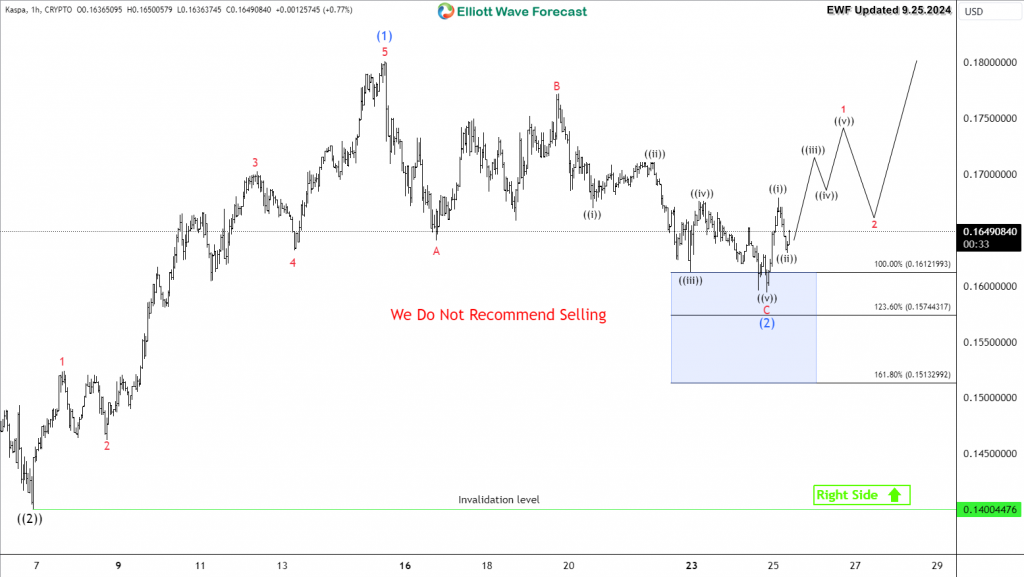
KAS rallied in 5 waves impulsive structure up from 9/6 low and it managed to trade above August peak which created a bullish sequence for the coin. The move higher in wave (1) ended at $0.18 then it started a 3 waves pullback in wave (2). The correction to the downside unfolded into a Zigzag structure and it reached the target area at equal legs $0.161 – $0.151.
The blue box presented in our chart is a technical area where we expect KAS to end the correction. Up from there, it turned to the upside either to start a new 5 waves advance in wave (3) or at least bounce it will bounce in 3 waves from there. We expect the coin to remain supported as buyers showed up and ideally the next move to the upside will be looking for target at $0.20 – $0.22.
KAS Hourly Chart 9.25.2024
(Click on image to enlarge)
More By This Author:
Coca-Cola Co Weekly Bullish SequenceElliott Wave View On EURJPY Expects Rally To Fail
NexGen Enery May Have Ended Correction
Disclaimer: Futures, options, and over the counter foreign exchange products may involve substantial risk and may not be suitable for all investors. Leverage can work against you as well as for ...
more


