
ISM Services Report: Growth In February
The Institute of Supply Management (ISM) has now released the February Services Purchasing Managers' Index (PMI). The headline Composite Index is at 56.5 percent, down 3.4 from 59.9 last month. Today's number came in below the Investing.com forecast of 61.0 percent.
Here is the report summary:
(Tempe, Arizona) — Economic activity in the services sector grew in February for the 21st month in a row — with the Services PMI® registering 56.5 percent — say the nation’s purchasing and supply executives in the latest Services ISM® Report On Business®.
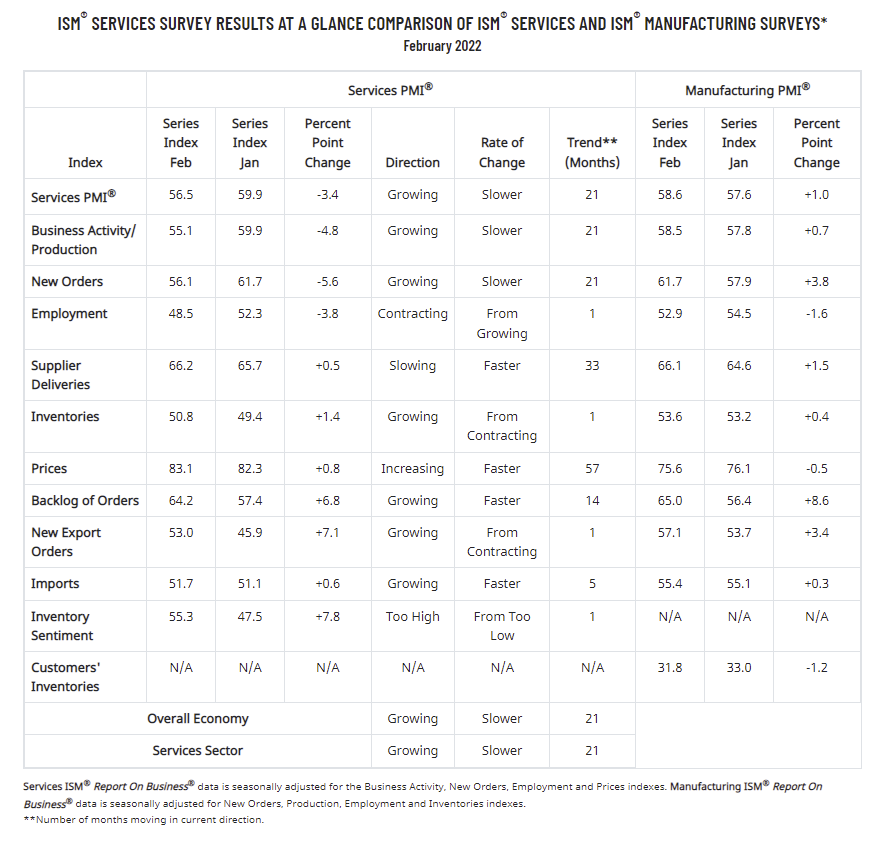
The report was issued today by Anthony Nieves, CPSM, C.P.M., A.P.P., CFPM, Chair of the Institute for Supply Management® (ISM®) Services Business Survey Committee: “In February, the Services PMI® registered 56.5 percent, 3.4 percentage points below January's reading of 59.9 percent. The Business Activity Index registered 55.1 percent, a decrease of 4.8 percentage points compared to the reading of 59.9 percent in January, and the New Orders Index figure of 56.1 percent is 5.6 percentage points lower than the January reading of 61.7 percent.
“The Supplier Deliveries Index registered 66.2 percent, 0.5 percentage point higher than the 65.7 percent reported in January. (Supplier Deliveries is the only ISM® Report On Business® index that is inversed; a reading of above 50 percent indicates slower deliveries, which is typical as the economy improves and customer demand increases.)
“The Prices Index registered 83.1 percent, up 0.8 percentage point from the January figure of 82.3 percent. Services businesses are beginning to replenish inventories, as the Inventories Index (50.8 percent, up 1.4 percentage points from January’s reading of 49.4 percent) and the Inventory Sentiment Index (55.3 percent, up 7.8 percentage points from January’s reading of 47.5 percent) grew in February to emerge from contraction or ‘too low’ territory.”
Nieves continues, “According to the Services PMI®, 14 industries reported growth. The composite index indicated growth for the 21st consecutive month after a two-month contraction in April and May 2020. Although there was a pullback for most of the indexes comprising the Services PMI®, in February, growth continues for the services sector, which has expanded for all but two of the last 145 months. Respondents continue to be impacted by supply chain disruptions, capacity constraints, inflation, logistical challenges and labor shortages. These conditions have affected the ability of panelists’ businesses to meet demand, leading to a cooling in business activity and economic growth.” [Source]
Unlike its much older kin, the ISM Manufacturing Series, there is relatively little history for ISM's Non-Manufacturing data, especially for the headline Composite Index, which dates from 2008. The chart below shows the Non-Manufacturing Composite.
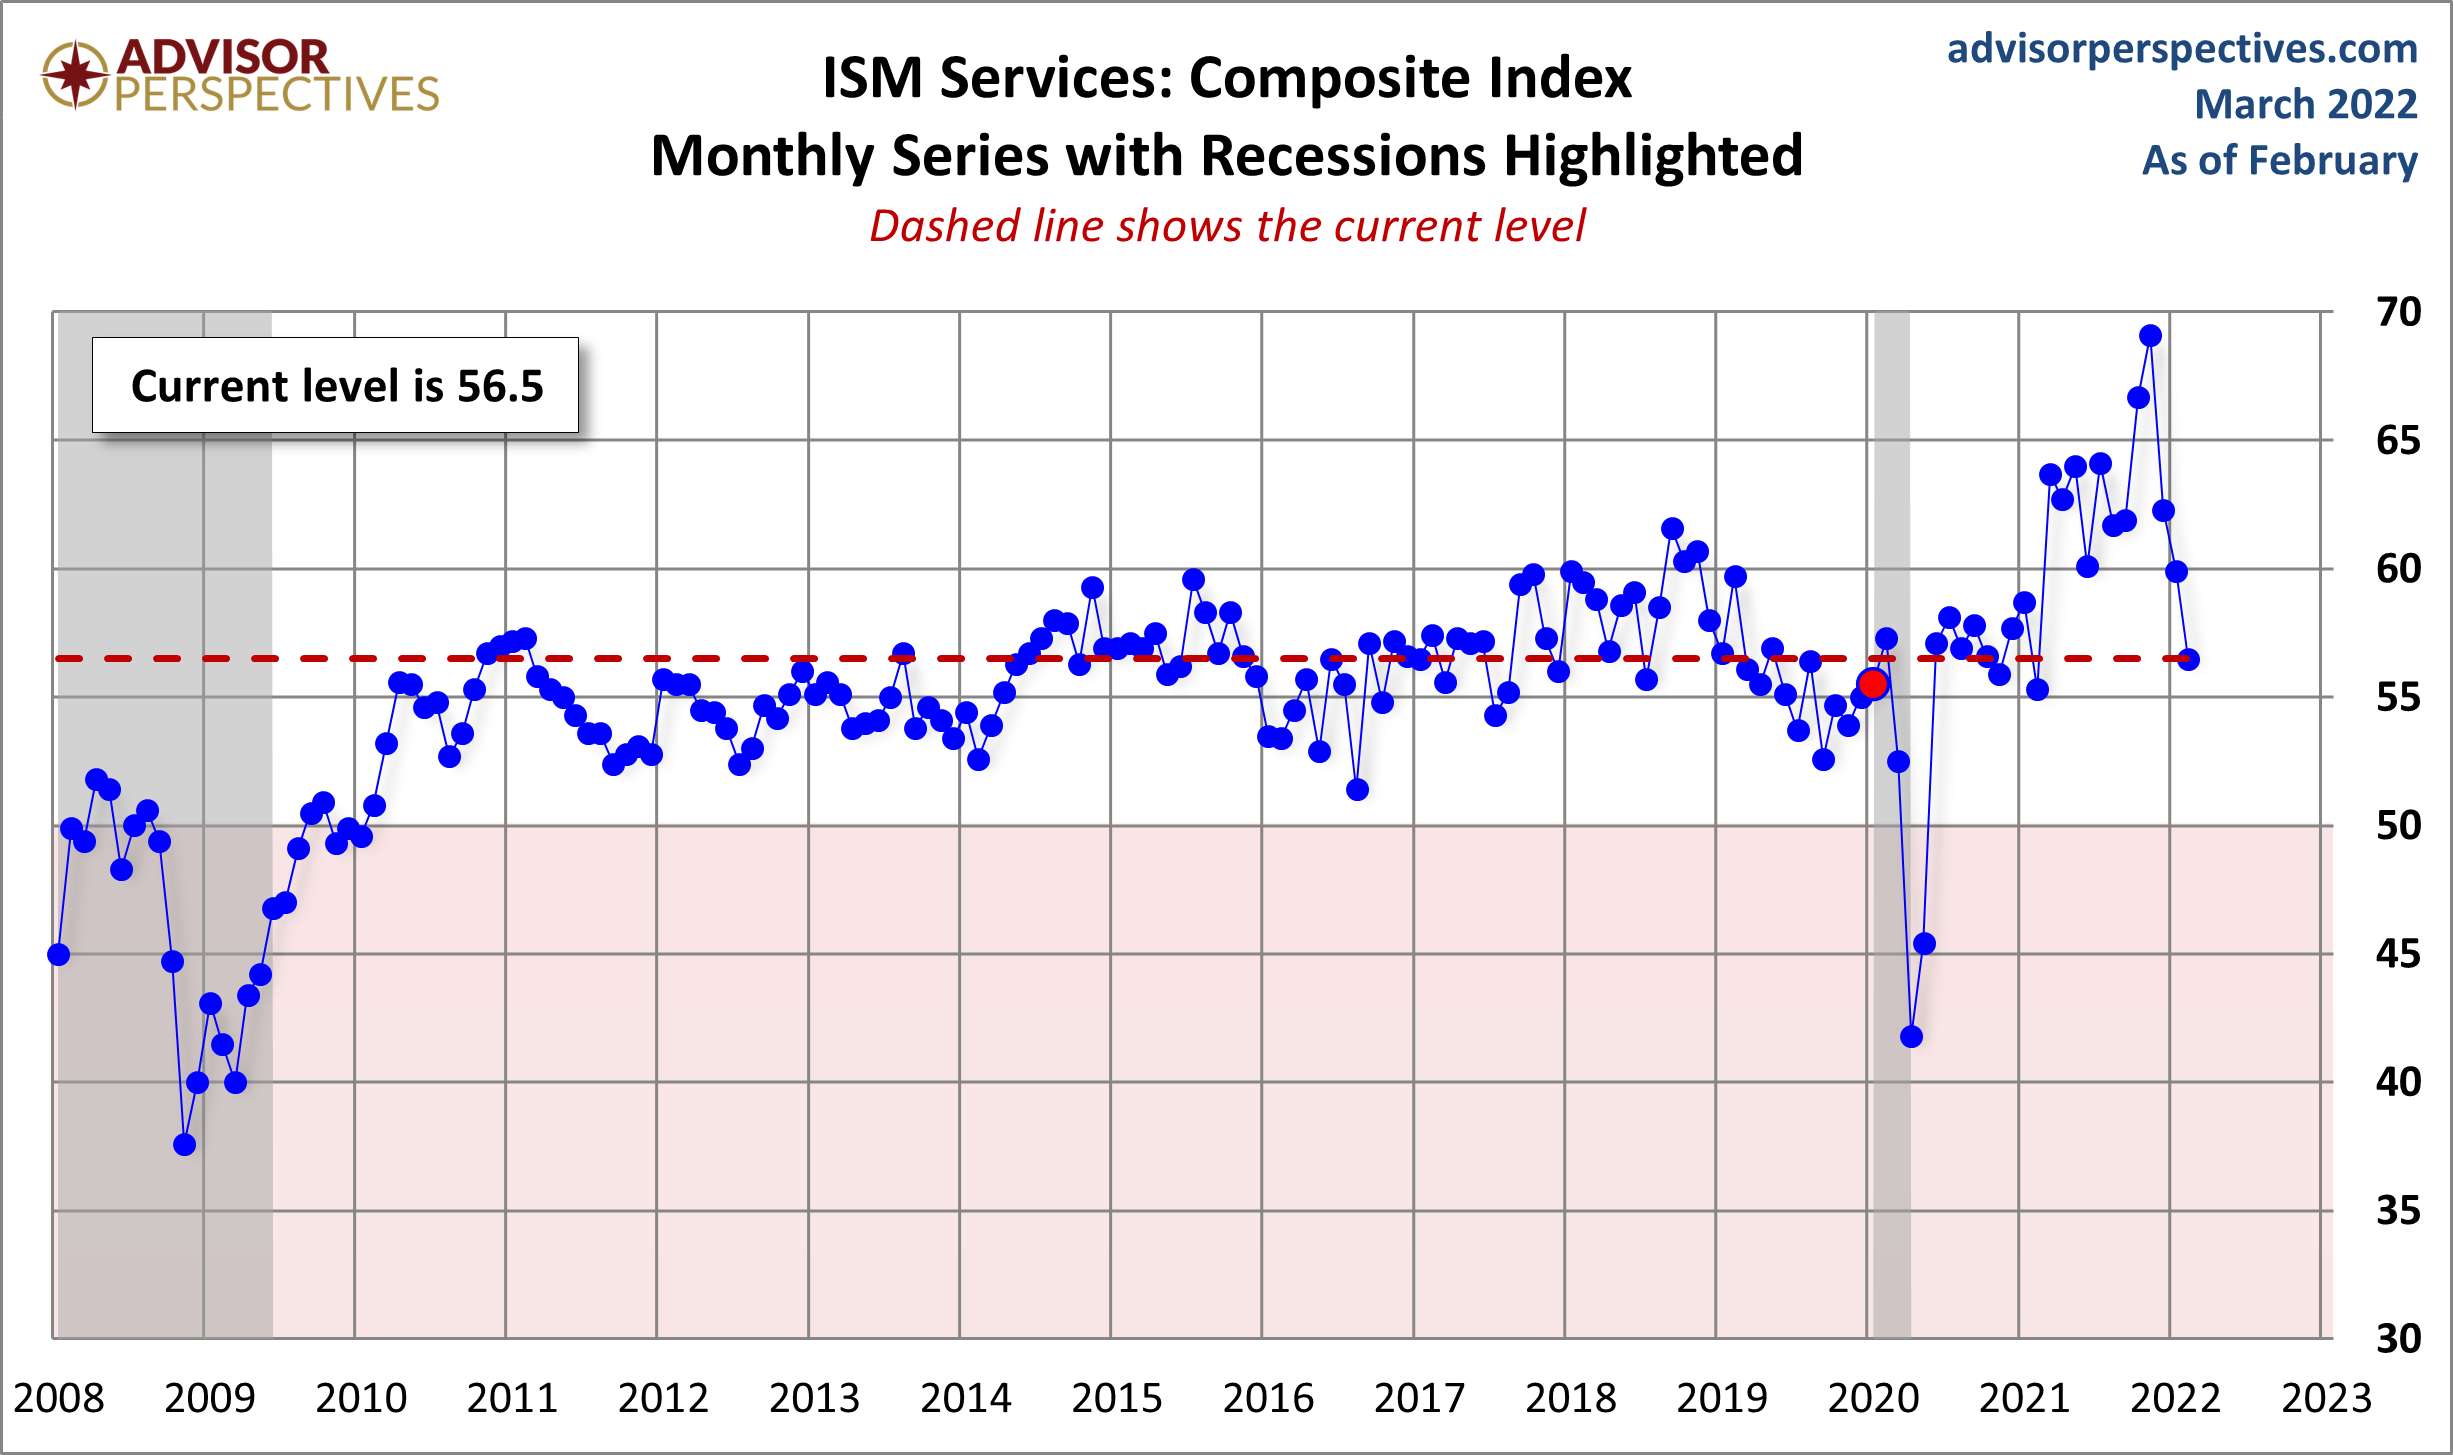
The more interesting and useful subcomponent is the Non-Manufacturing Business Activity Index. The latest data point at 59.9 percent is down 2.4 from a seasonally adjusted 62.3 the previous month.
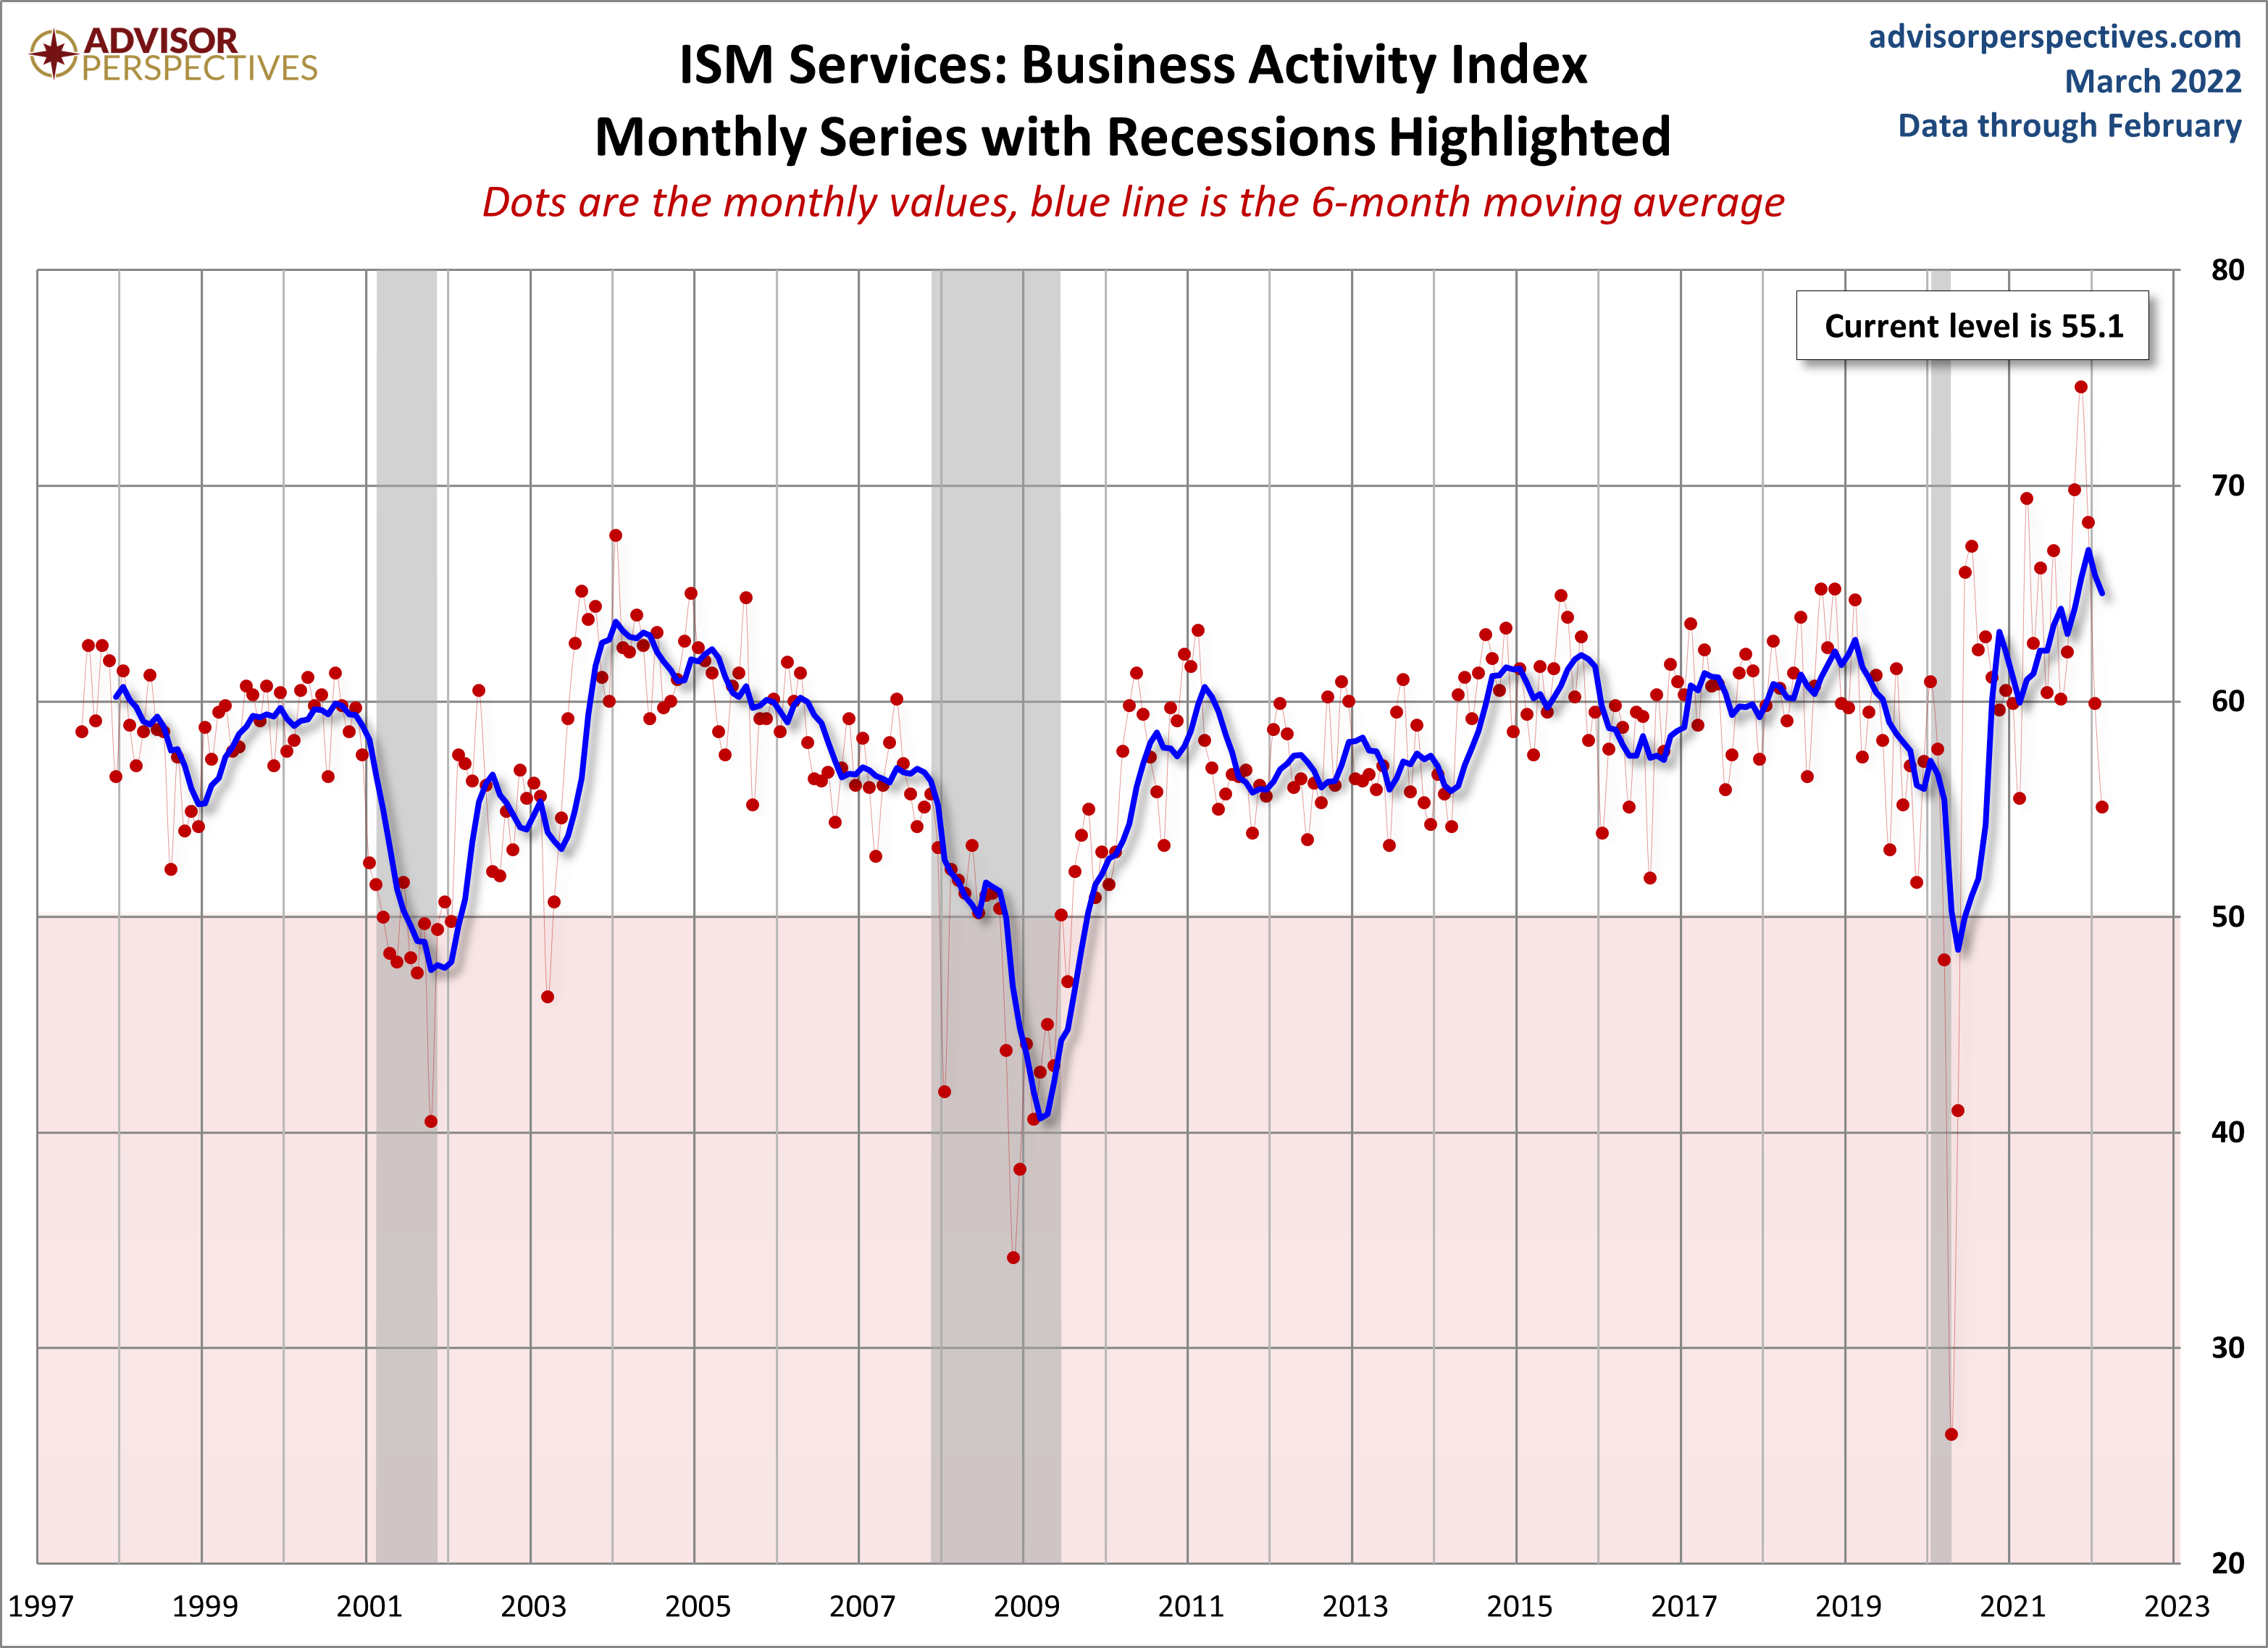
For a diffusion index, this can be an extremely volatile indicator, hence the addition of a six-month moving average to help us visualize the short-term trends.
Theoretically, this indicator should become more useful as the time frame of its coverage expands. Manufacturing may be a more sensitive barometer than Non-Manufacturing activity, but we are increasingly a services-oriented economy, which explains our intention to keep this series on the radar.
Here is a table showing the trend in the underlying components.
Here is a link to our coverage of the latest ISM Manufacturing report.


