
ISM Manufacturing Index: Down 0.8 In February
This morning the Institute for Supply Management published its monthly Manufacturing Report for February. The latest headline Purchasing Managers Index (PMI) was 50.1, a decrease of 0.8 percent from 50.9 the previous month. Today's headline number was below the Investing.com forecast of 50.5 percent.
Here is the key analysis from the report:
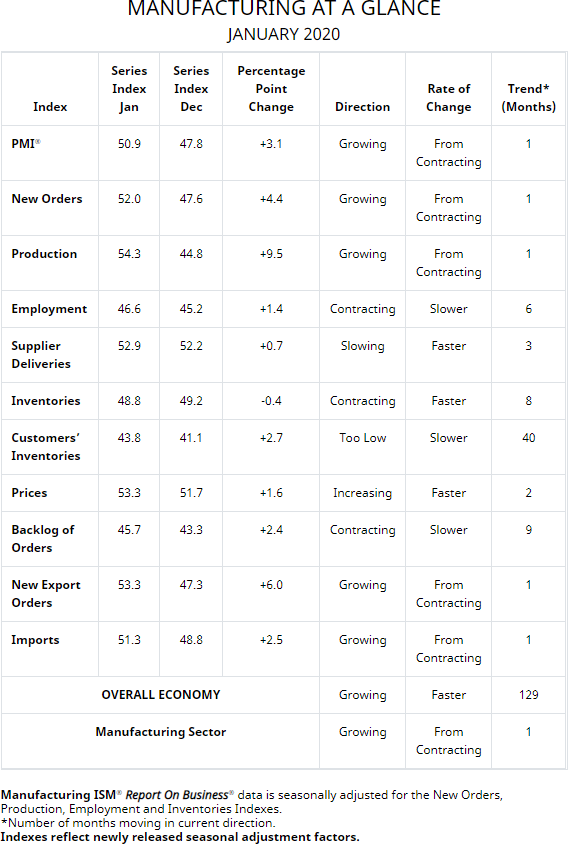
The report was issued today by Timothy R. Fiore, CPSM, C.P.M., Chair of the Institute for Supply Management® (ISM®) Manufacturing Business Survey Committee: “The February PMI® registered 50.1 percent, down 0.8 percentage point from the January reading of 50.9 percent. The New Orders Index registered 49.8 percent, a decrease of 2.2 percentage points from the January reading of 52 percent. The Production Index registered 50.3 percent, down 4 percentage points compared to the January reading of 54.3 percent. The Backlog of Orders Index registered 50.3 percent, an increase of 4.6 percentage points compared to the January reading of 45.7 percent. The Employment Index registered 46.9 percent, an increase of 0.3 percentage point from the January reading of 46.6 percent. The Supplier Deliveries Index registered 57.3 percent, up 4.4 percentage points from the January reading of 52.9 percent. The Inventories Index registered 46.5 percent, 2.3 percentage points lower than the January reading of 48.8 percent. The Prices Index registered 45.9 percent, down 7.4 percentage points as compared to the January reading of 53.3 percent. The New Export Orders Index registered 51.2 percent, a decrease of 2.1 percentage points as compared to the January reading of 53.3 percent. The Imports Index registered 42.6 percent, an 8.7-percentage point decrease from the January reading of 51.3 percent.
Here is the table of PMI components.
The chart below shows the Manufacturing Composite series, which stretches back to 1948. The eleven recessions during this time frame are indicated along with the index value the month before the recession starts.
(Click on image to enlarge)
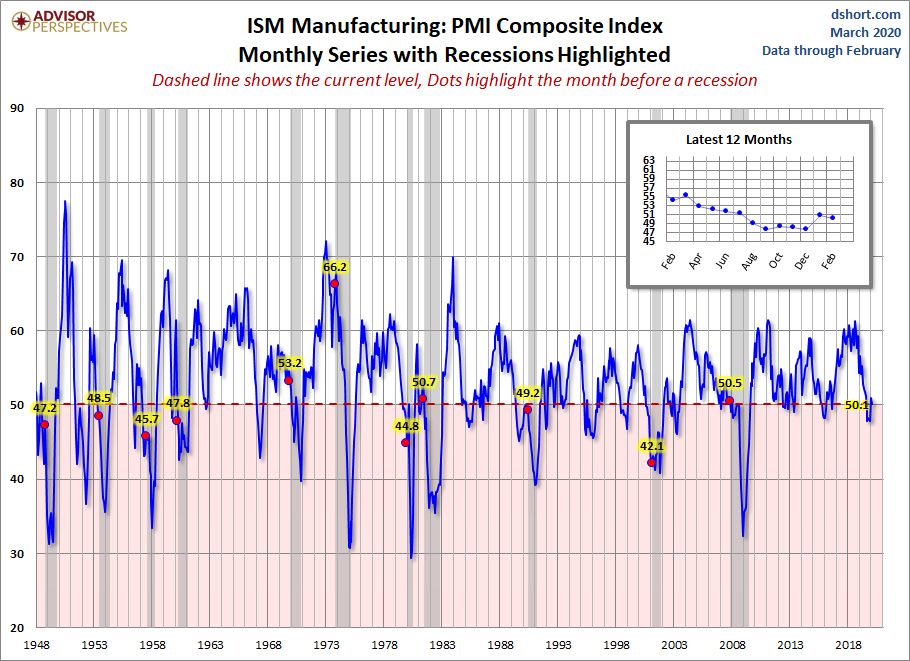
For a diffusion index, the latest reading is 50.1 and indicates expansion. What sort of correlation does that have with the months before the start of recessions? Check out the red dots in the chart above.
Here is a closer look at the series beginning at the turn of the century.
(Click on image to enlarge)


