
This morning the Institute for Supply Management published its monthly Manufacturing Report for December. The latest headline Purchasing Managers Index (PMI) was 48.4, down 0.6 from the previous month and in contraction territory. Today's headline number was below the Investing.com forecast of 48.5.
Here is an excerpt from the report:
Fiore continues, “The U.S. manufacturing sector again contracted, with the Manufacturing PMI® at its lowest level since the coronavirus pandemic recovery began. With Business Survey Committee panelists reporting softening new order rates over the previous seven months, the December composite index reading reflects companies’ slowing their output. Demand eased, with the (1) New Orders Index remaining in contraction territory, (2) New Export Orders Index markedly below 50 percent, (3) Customers’ Inventories Index in ‘just right’ territory, and (4) Backlog of Orders Index recovering slightly but still in strong contraction. Output/Consumption (measured by the Production and Employment indexes) was neutral, with a combined zero-percentage point impact on the Manufacturing PMI® calculation. The Employment Index moved back into expansion, and the Production Index dropped into contraction territory. Many panelists’ companies confirm that they are continuing to manage head counts through a combination of hiring freezes, employee attrition and layoffs. Inputs — defined as supplier deliveries, inventories, prices and imports — accommodated future demand growth. The Supplier Deliveries Index indicated faster deliveries, and the Inventories Index expanded at a faster rate as panelists’ companies continued to effectively manage the total supply chain inventory. The Prices Index contracted for the third consecutive month and has declined in each reading since March 2022, when it registered 87.1 percent.
Here is the table of PMI components.

The chart below shows the Manufacturing Composite series, which stretches back to 1948. The eleven recessions during this time frame are indicated along with the index value the month before the recession starts.
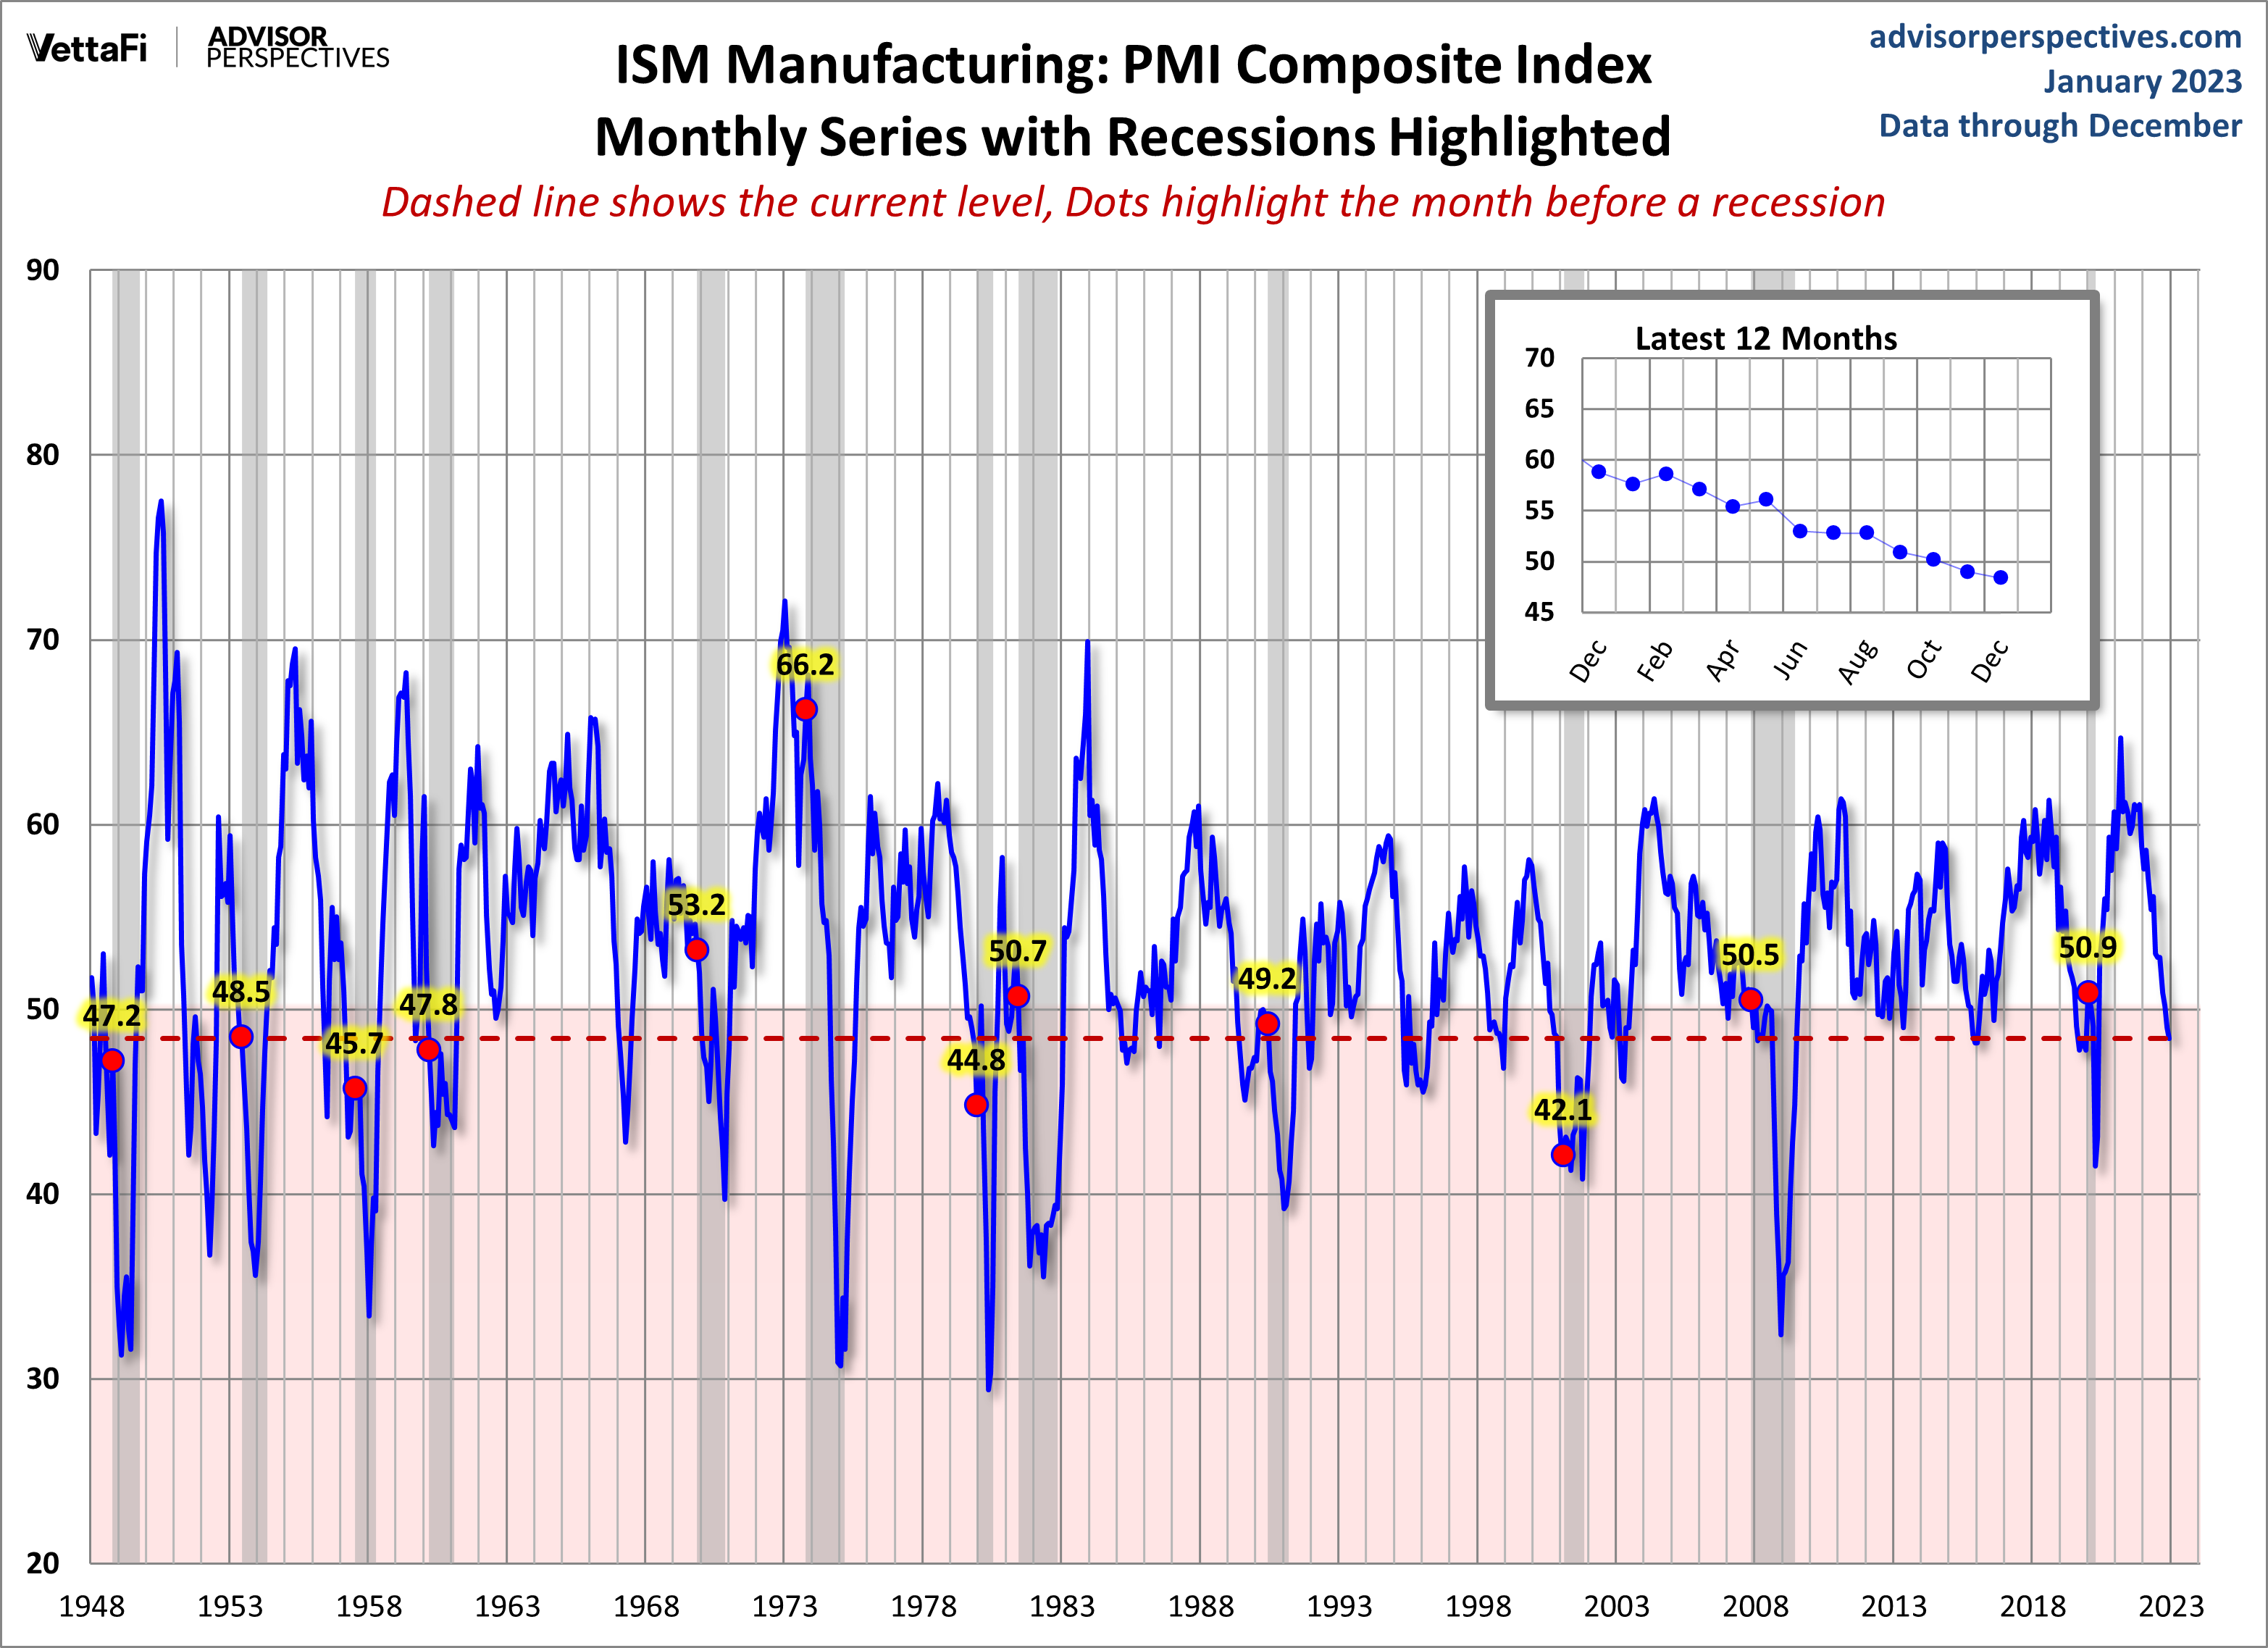
For a diffusion index, the latest reading is 49.0 and indicates contraction. What sort of correlation does that have with the months before the start of recessions? Check out the red dots in the chart above.
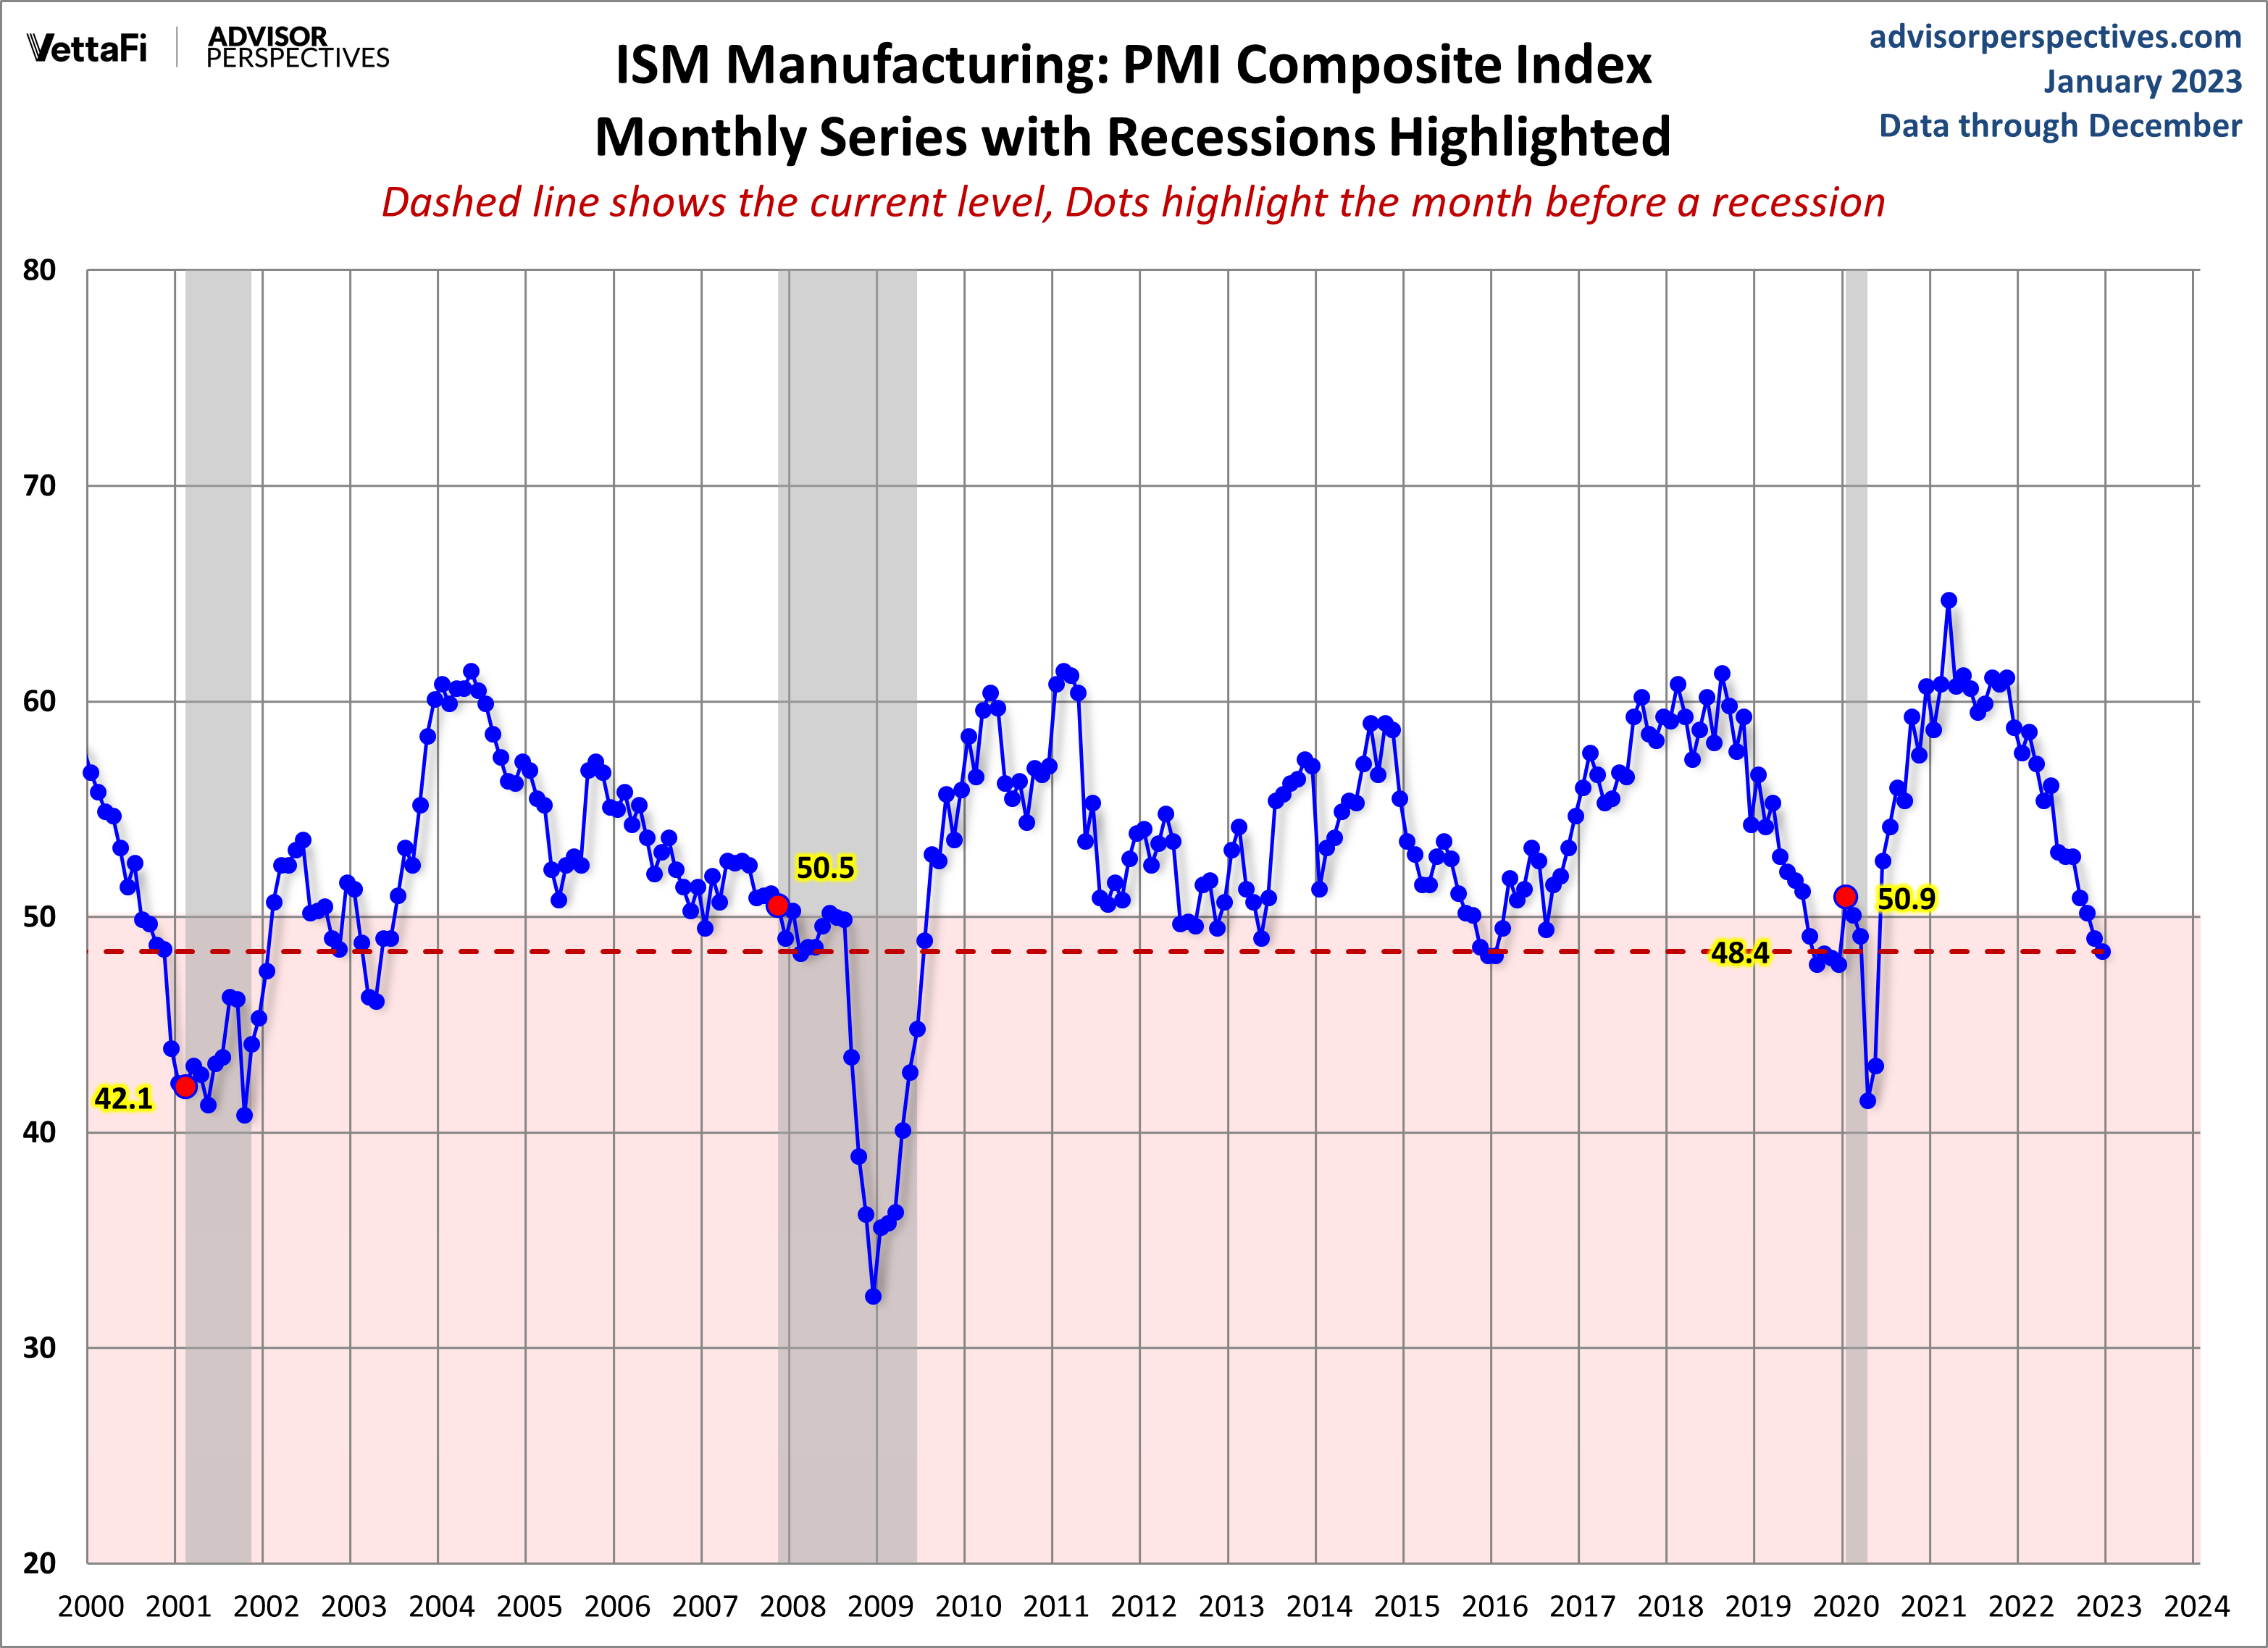
Here is a closer look at the series beginning at the turn of the century.
Note: This commentary used the FRED USRECP series (Peak through the Period preceding the Trough) to highlight the recessions in the charts above. For example, the NBER dates the last cycle peak as December 2007, the trough as June 2009, and the duration as 18 months. The USRECP series thus flags December 2007 as the start of the recession and May 2009 as the last month of the recession, giving us an 18-month duration. The dot for the last recession in the charts above is thus for November 2007. The "Peak through the Period preceding the Trough" series is the one FRED uses in its monthly charts, as illustrated here.
More By This Author:
Crestmont Market Valuation Update: December 2022Treasury Yields: A Long-Term Perspective - Tuesday, Jan. 3
Moving Averages: S&P Down 5.9% In December, Down 19.4% In 2022


Comments
Log in or sign up to join the conversation.