
Near-Term Bearish Signs For Bitcoin Cash
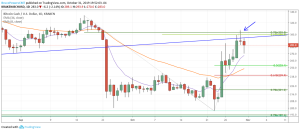
A bearish daily Doji candlestick pattern occurs in Bitcoin Cash (BCH/USD) following seven days up, while a potential 1-day reversal triggered with a break below the candle’s low. This is the first time in eight days that price has dropped below the prior day’s low and is a clear change in the pattern of higher daily lows and higher daily highs.
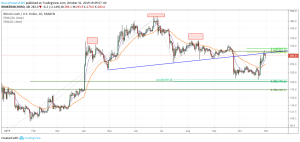
The potential topping pattern occurs in an area of potential resistance identified by:
• Neckline resistance of large bearish head and shoulder top pattern (HS).
• Area of 78.6% Fibonacci retracement of most recent swing high to low decline.
• Bearish 14-period divergence occurs on 4-hour chart.
Most recent low to $196.80 was not close to reaching the measuring objective based on a percentage measurement, of approximately $144.54. Therefore, this pair has the potential to fall well below the most recent swing low. This doesn’t mean that it will, just that it could.
A move above the most recent trend high at $306.70 will negate the above potentially bearish analysis.
Disclosure: Above analysis is for educational purposes only. Proceed at your own risk. All information given here is largely based on technical analysis and the analysis is very dynamic in nature and ...
more

