
Inverse Volatility Trading – A Smart Investment Strategy For Income
Why trade inverse volatility?
Since 2011, trading inverse volatility has been the one of the most rewarding investment strategy in the markets with annual returns well above 30%, depending on the instruments used.
Can I trade this?
If you can trade ETFs in your account, you can trade an inverse volatility strategy.
VIX is the CBOE Volatility Index, a popular measure of the implied volatility of S&P 500 index options; Often referred to as the fear index or the fear gauge, the VIX represents one measure of the market’s expectation of stock market volatility over the next 30-day period.
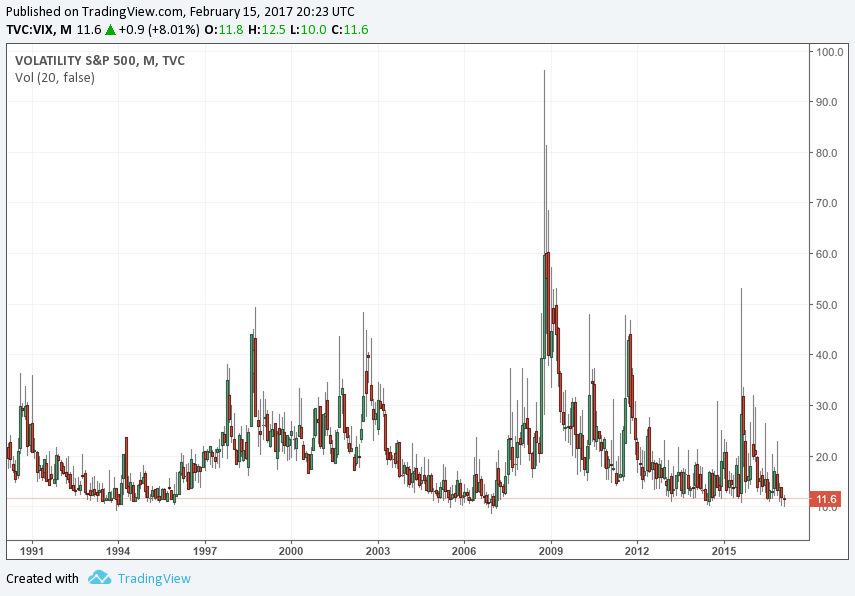
Volatility Index VIX Chart
What is unique about the VIX index is that it is mean-reverting. Unlike a stock, it will not go indefinitely on an up or down trend. When markets crash or unexpected events occur, the VIX peaks. When eventually markets return to some type of normality, VIX reverts towards it’s mean value. The VIX index is not tradeable but there are futures, ETFs and options based on the VIX that are. These are used as insurance by professional portfolio managers. By buying VIX Futures a manager can hedge and protect their stock portfolio from risk, without having to sell individual stocks. In many ways buying VIX futures is like buying an insurance policy against a market crash. And as most insurance policies it costs money.
The strategy: Selling insurance and collecting Premium
On the other side of that trade, someone sells those future contracts to the hypothetical manager. That trader collects a type of insurance premium. This is due to the term structure of the VIX futures.
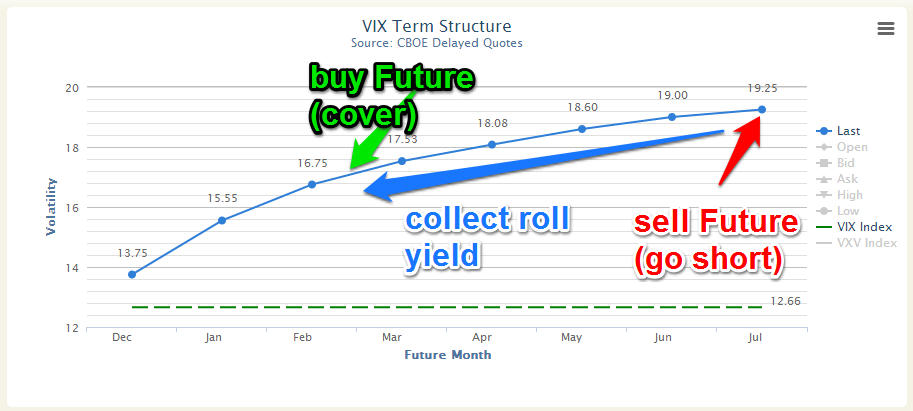
Collect Volatility Roll Yield – Logical-Invest.com
Most of the time, VIX futures are in “contago”. This means that a Future that expires in 7 months is more expensive than one that expires in 6 months, which in turn is more expensive than the 5 month out, etc.
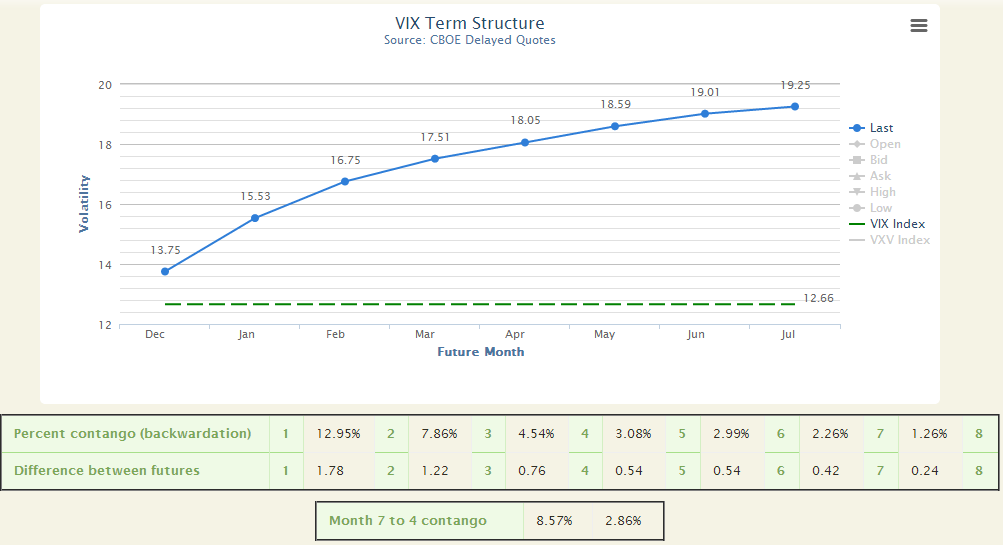
Volatility Index Futures Term Structure in Contago
So in order to be “insured” all the time you have to keep selling contracts that are about to expire and buy contracts that are further out in the curve . In the process you keep loosing money. Let’s take an example:
Let’s assume it is January 2017 and we want to protect 1 million worth of stocks. We will buy VIX futures. Let’s say we buy the March future at a price of 16. Two months later, the contracts are at a price of 14 and are about to expire. To keep our protection we need to “roll” them forward. We sell them at 14 and buy the ‘futjher out” May contracts at 16. You notice that we bought at 16, sold at 14 and re-bought at 16. We lost $2 (or $2000/contract) just to keep the same protection.
For the regular investor who has no access to future contracts, VXX is an extremely popular and liquid ETF that can be bought and sold like a stock. VXX holds VIX futures contracts and rolls them as they expire. VXX is considered an easy way to buy “VIX insurance”. But t pays a price for that. Look at VXX’s price chart.
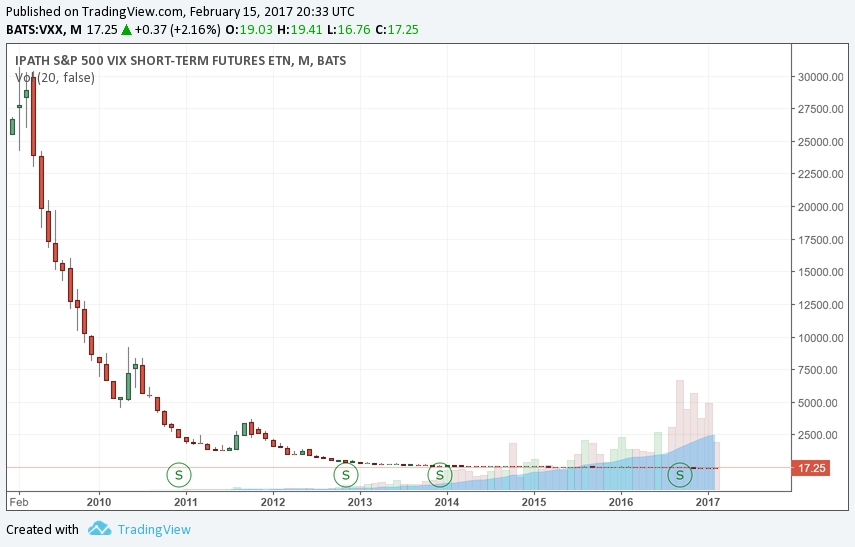
Volatility Index VIX Chart 2010-2017
Same chart from 2014 to get a better view of the losses.
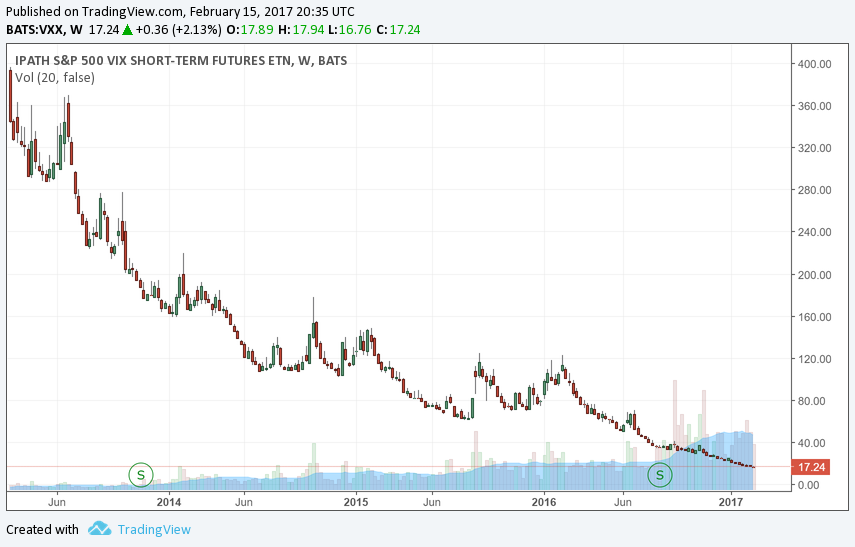
Volatility Index VIX Chart 2014-2017
Shorting the VXX?
Shorting the VXX is the first thing that comes to mind. It is actually a risky strategy. From August 2015 to September 2015, due to the Brexit vote, VXX rose from low of $62 to a high of $123. Being short the VXX would result in almost 100% loss. Another limitation in shorting the VXX is finding shares to short.There is an easy alternative: An ETF that actually gains from the roll premium: XIV.
Our strategy, The Maximum Yield strategy was introduced by Frank Grossmann in 2013. It takes advantage of the roll decay but uses methods to protect from large drawdowns. It uses an ETF that gains from roll decay but is much less volatile than XIV. The strategy also hedges it’s position with an adaptive allocation to a treasury ETF. It re-balances only twice a month making it easy to follow.
As you can see from the graph below the strategy was first published in 2013 and shortly after it became available to subscribers. It has been profitable since returning a 108% profit. It returned 29% in 2016.
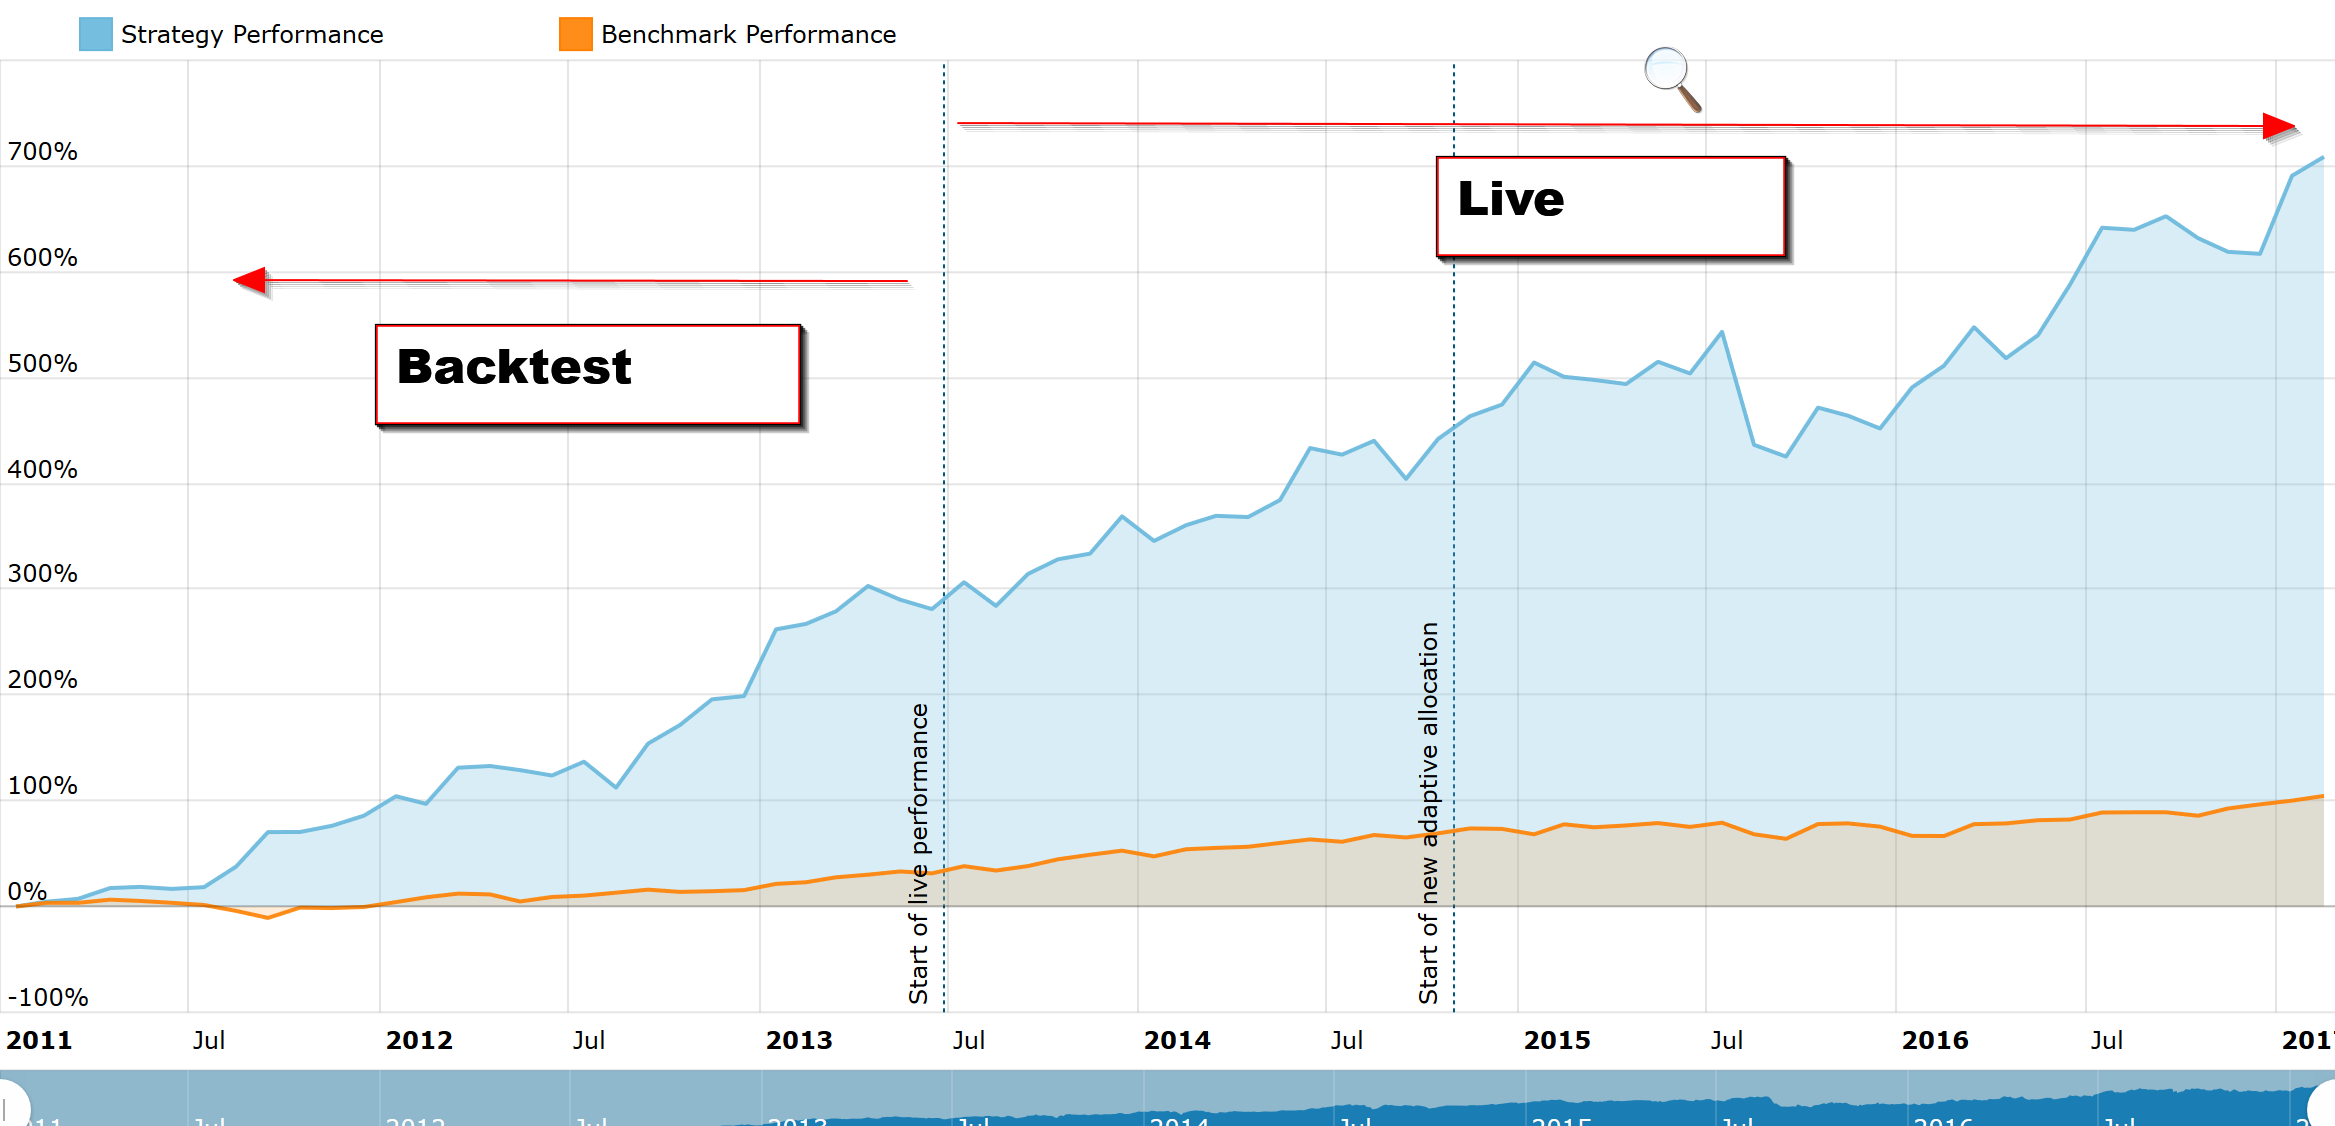
The Maximum Yield Investment Strategy performance chart – Logical-Invest.com
You can find more information on the logic and performance of the Maximum Yield Strategy at the MYRS Logical-Invest.com home.


Why not update this with more current data? Seems like the charts are rather out of date.