How To Measure Market Fragility

Market trends are built on disbelief. They climb a wall of worry and fall down the stairs of hope. It’s the conversion of non-believers to full-on punch drinkers that eventually mark the major turning points.
The oscillations, the dips, the volatility along the way are the price the player pays to ride out a big move.
I can’t remember who made the analogy (Ed Seykota, maybe?). But he compared a trend to a rose. To hold a rose you have put up with the thorns. Most traders think the thorns are poison-tipped and quickly drop it like it’s a turd covered stick.
Experienced traders know that a thorn is an opportunity to enter or add to a position. In fact, thorns are a feature, not a bug.
They perpetuate the disbelief in the trend and keep positioning and sentiment from reaching a point of criticality that translates into trend fragility and raises the specter of a full-blown phase-shift (reversal).
In markets, frequent dips help prevent major selloffs and effectively lengthen the duration of a given trend. Knowing this, as traders and investors, our process needs to exploit and harvest the positive function of dips (thorns) and not let them shake us out of positions. That’s what the following framework aims to do.
This article outlines the three-part decision tree we use to identify market fragility and trends, decide how to allocate our portfolio, and when to add/reduce risk:
- The Set-up
- Conditions
- The Trigger
The Set-up: Using Technicals As Our Guide
A Setup is a technical point on a chart. In physics terms, it would be called the critical point, which is the zone at which a complex system sits between order and disorder. The area at which a phase transition can take place.
In our framework, the Setup is when the price touches the lower band of a standard 20-day 2stdev Bollinger Band in an uptrend. But, in reality, it could be a number of things, such as a Keltner or Donchian Channel break, a swing below a pivot point, a percentage move off new highs, etc…
The exact details are fairly unimportant and you can use something else that better fits your process and objectives. The key is that it’s a critical point that shouldn’t be too frequently hit because you’ll end up with a lot of noise.
Many investors worry about a large selloff when the market is hitting new highs, which just boggles the mind because new highs are an obvious trait of a bull trend. A bull trend contains many oscillations that vary in amplitude. Again, these are thorns and they’re a good thing.
We don’t care about dips to the middle range of the band, because those are noisy and are more often than not, a buying opportunity — remember Newton’s First Law of Markets, a trend in motion tends to stay in motion — statistically speaking, a trend will continue 80% of the time.
A larger selloff is what we’re concerned with and it has to pass through the lower Bollinger Band. I know I’m making some obvious statements here, but bear with me as I build on the logic behind the framework.
So, it’s only when the price hits the lower Bollinger Band in an uptrend that we need to follow through on the rest of our framework.
Conditions: Measuring Potential of Trend Fragility
Conditions are a measure of the potential amplitude or the overall fragility of the trend at that point in time. They give the probabilities for a phase-shift, a reversal of trend.
To use the sandpile analogy, we can think of Conditions as a measure of slope. The steeper the slope the greater the potential for an avalanche.
We measure Conditions through a Trifecta of Breadth, Liquidity, and Sentiment. There is no panacea or perfect indicator in markets. It can’t exist because if there was it would be arbed out and reflexivity would kill its value as a signal. Using the Trifecta approach of collecting data points from disparate areas of the market, we can holistically build out a more effective context.
Let’s walk through each one:
- Breadth: Strong breadth is similar to an army with a deep and disciplined line. Each issue in an index is equivalent to a soldier standing on that line. And that is what various indicators of breadth aim to measure.
- Liquidity: Liquidity can be thought of as the trend in demand for risk. It’s best measured by tracking what’s going on in the credit markets.
- Sentiment: Exuberant sentiment and crowded positioning are behind nearly every major market selloff. Overly eager investors out over their skis are what sows the seeds for a reversal in trend.
Putting It All Together: Real-World Example
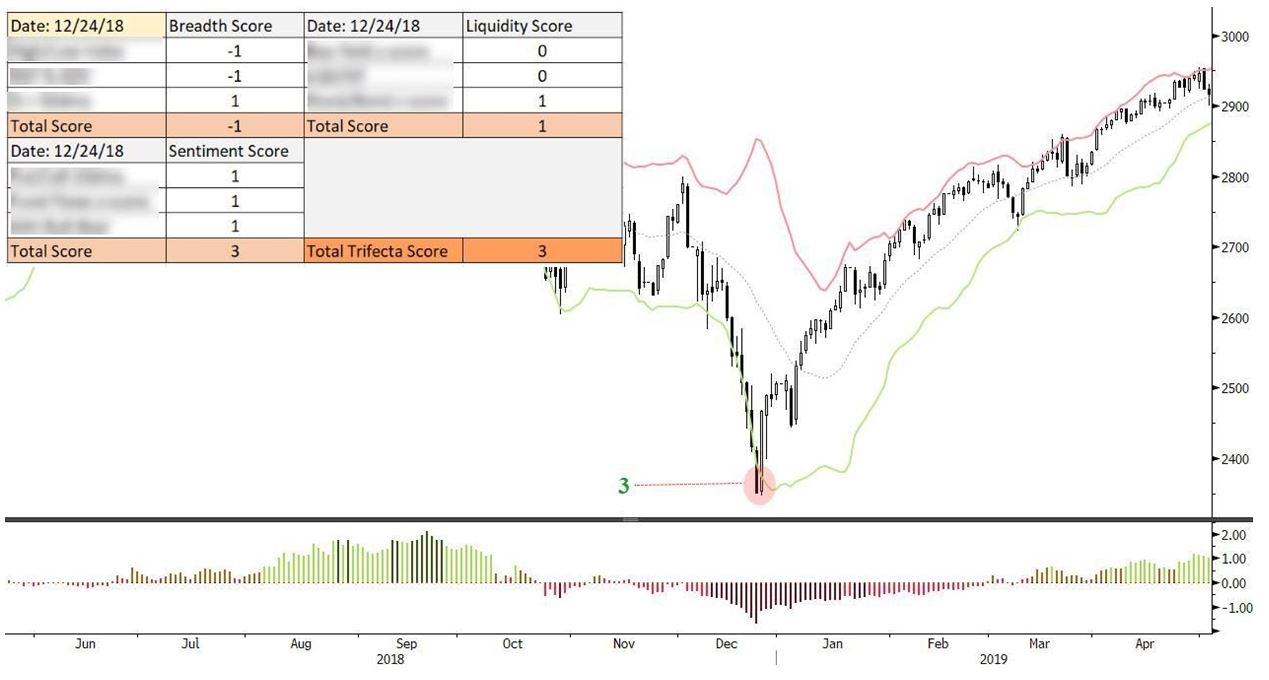
Beginning at the bottom of the December 2018 selloff when everyone was talking about recession, the inverted yield curve, and trouble in China.
The Trifecta Lens gave us a score of +3. Any score from zero and above is bullish, so a positive three is a very strong reading. This reading was followed the next day by a large bullish reversal Trigger bar.

The important part is that we use the entirety of the framework; the Tape, the Breadth, the Liquidity, and the Sentiment/Positioning to build a contextualized picture of what’s really going on in the market. This prevents biases from creeping in, clouding our judgment, and leading to emotionally reactive decision making.


Great dissemination, clarity of process through objective dynamic market touch points!