
How To Benefit From Trend And Momentum In QQQ
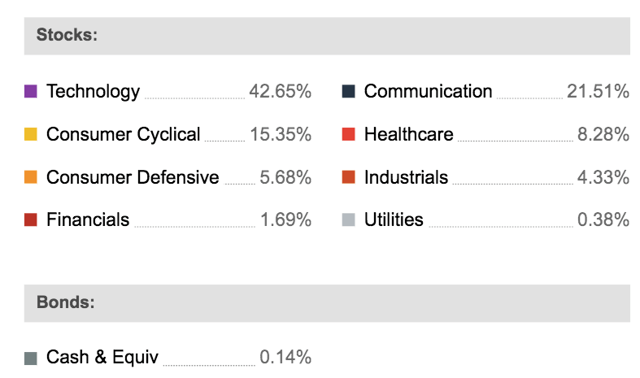
The Invesco QQQ (NASDAQ:QQQ) replicates the Nasdaq 100 index. As such, the ETF is aggressively exposed to high-growth stocks in sectors such as technology, communications, and consumer cyclical. These sectors represent 42.6%, 21.51%, and 15.35% of the portfolio, respectively.
Source: Seeking Alpha Essential
Because of this, QQQ can be a particularly profitable investment when the economy is doing well, and risk appetite is rising in the market. Conversely, the ETF can suffer severe losses during bear markets and in times of declining risk appetite among investors.
To put the performance in perspective, the chart shows the long-term returns for Invesco QQQ versus SPDR S&P 500 (SPY). Betting on QQQ can produce much bigger gains over the years, but the downside risk is also much larger.
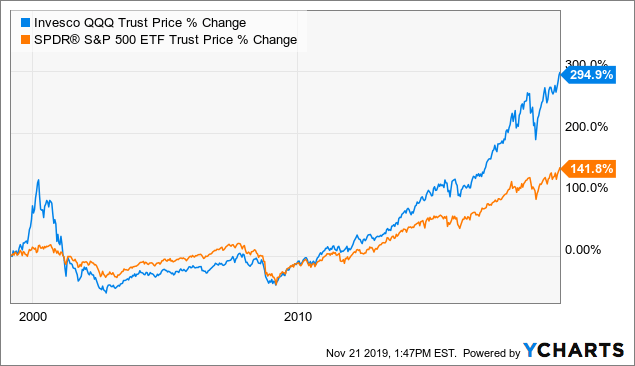 Data by YCharts
The chart below shows the maximum drawdowns - meaning the maximum loss from the peak - for QQQ in every year since 1999. The ETF had four different years with drawdowns of more than 50% of its value. Three of those years were consecutive in 2000, 2001, and 2002. Over that complete period, the ETF lost over 80% of its value. Then, again during the financial crisis in 2008, the instrument declined by 50%.
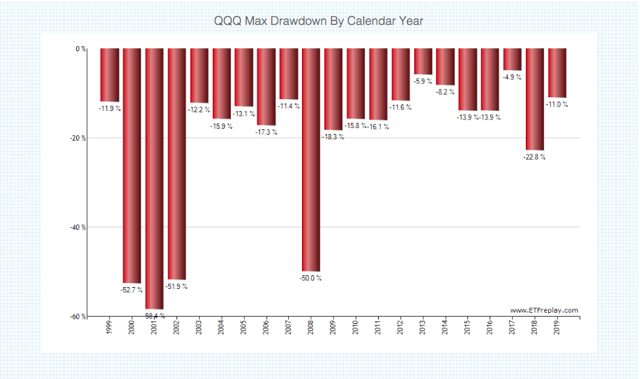
Source: ETFReplay
Those big losses can be devastating to your wealth. It can take more than a decade to recover from large drawdowns in the stock market. For that reason, it makes sense to look for different strategies to capitalize on the superior upside potential provided by QQQ while also controlling for downside risk.
No strategy can be perfect or infallible, and even the best strategies will necessarily underperform the benchmark over some periods. However, a combination of trend following and momentum could be a smart approach to consider in order to optimize the risk vs reward equation in QQQ over the long term.
The Trend Is Your Friend
Trend following can be a simple and effective strategy to manage downside risk, and it has been proven to work in different markets and asset classes over the long term. One of the best research papers ever written on trend-following is by the research team at AQR, and it's entitled A Century of Evidence on Trend-Following Investing.
The paper examines trend-following strategies over more than a century of data and across different asset classes - stocks, commodities, currencies, etc. - in different countries.
The conclusions from the study are quite powerful, from the research paper:
In this article, the authors study the performance of trend-following investing across global markets since 1880, extending the existing evidence by more than 100 years using a novel data set. They find that in each decade since 1880, time series momentum has delivered positive average returns with low correlations to traditional asset classes. Further, time-series momentum has performed well in 8 out of 10 of the largest crisis periods over the century, defined as the largest drawdowns for a 60/40 stock/bond portfolio. Lastly, time series momentum has performed well across different macro environments, including recessions and booms, war and peacetime, high and low-interest rate regimes, and high- and low-inflation periods
These findings show that trend-following has produced superior risk-adjusted returns in different periods and market environments, and across all kinds of instruments. If the statistical evidence is any valid guide for the future, it is important to acknowledge that trend-following has as much statistical support as it can get.
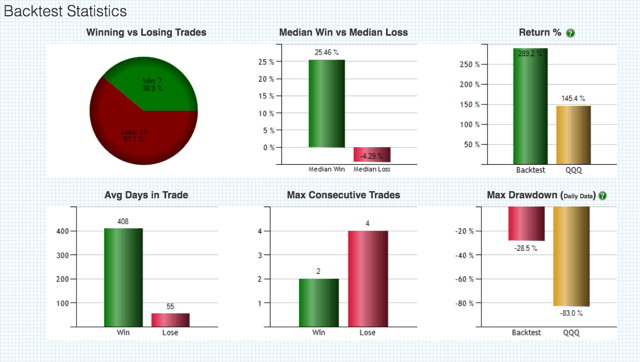
The chart below shows the backtested performance of a very simple trend-following strategy that buys QQQ only when the ETF is trading above the 200-day moving average. When QQQ is in a downtrend, the portfolio is allocated to cash.
Source: ETFreplay
The numbers are quite solid, since the year 2000 the strategy gained 289.2%, while buy and hold investors in QQQ gained only 145.4%. Much more important, the maximum drawdown for the trend-following strategy was -28.5% versus a devastating maximum drawdown of -83% for buy and hold in QQQ.
Source: ETFreplay
Importantly, this outstanding outperformance is due to the fact that QQQ suffered massive drawdowns from 2000 to 2002 and then again in 2008. Since the trend following strategy reduced the damage in those bear markets, this explains why both returns and risks are much better.
On the other hand, if we focus solely on returns since 2009, trend following produced disappointing performance over that period.
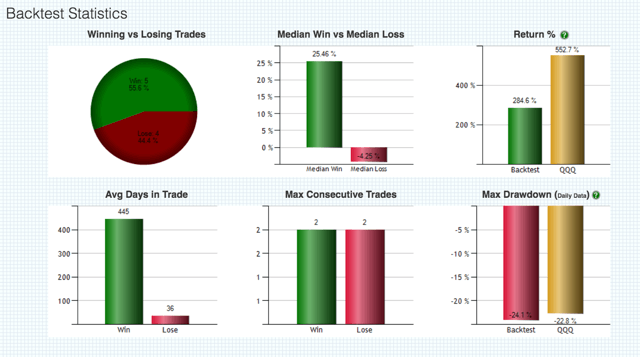
Source: ETFreplay
This should come as no surprise at all. Over long periods of time, when we have big uptrends and downtrends, a trend following strategy can be remarkably effective at improving performance versus buy and hold. However, during a sustained bull market such as the one we are having in QQQ since 2009, buy and hold is practically impossible to beat.
Trend Following And Momentum Combined
In addition to focusing on the QQQ ETF itself, we can also look under the surface to select the stocks with the strongest performance in the QQQ portfolio in an attempt to further optimize performance.
Momentum is a double-edged, because the stocks that go up the most when they are moving in the right direction are oftentimes the same stocks that go down the most during bear markets. However, focusing on stock selection via the momentum factor can potentially make the strategy more effective over the long term.
The Stocks on Fire system is a quantitative algorithm that ranks stocks in a particular universe based on a combination of two main factors: fundamental momentum and price momentum.
Fundamental momentum evaluates how earnings and sales expectations are evolving for the company. This factor is basically a combination of five different variables:
- The percentage increase in earnings expectations for the current quarter.
- The percentage increase in earnings expectations for the current year.
- The percentage increase in earnings expectations for next year.
- The percentage increase in sales expectations for the current year.
- The percentage increase in sales expectations for next year.
The price performance component in the ranking system measures price changes over the past 4 quarters. This factor is looking for stocks that are consistently outperforming the market over recent time periods, as measured by variables such as:
- Return over the past 3 months.
- Return over 3 months 3 months ago.
- Return over 3 months 6 months ago.
- Return over 3 months 9 months ago.
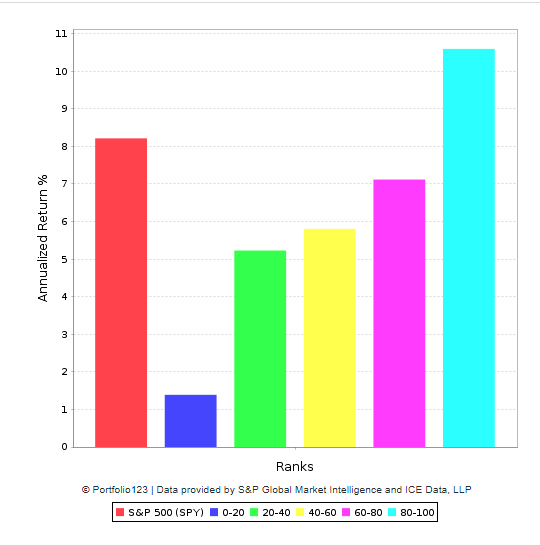
Looking at the long-term backtested data, there is a direct correlation between the Stocks on Fire ranking and annualized returns. Companies in the top quintile, meaning those with a Stocks on Fire ranking above 80 tend to materially outperform the market.
Data from S&P Global via Portfolio123
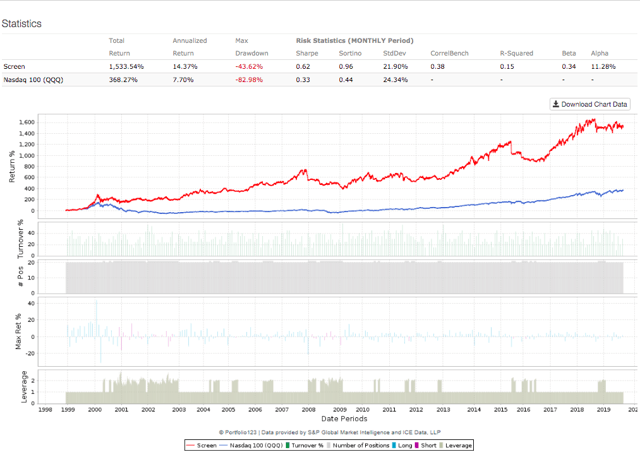
The strategy below buys the 20 stocks in the QQQ portfolio with the highest ranking based on the Stocks on Fire algorithm. In addition to this, the portfolio is hedged with a 100% short position in QQQ in times when the ETF is trading below the 200-day moving average. Trading commissions are assumed to be 0.2% per transaction.
Backtested performance numbers are quite strong over the long term. The strategy produces a total cumulative return of 1,533% versus 368% for buy and hold investors in QQQ. The maximum drawdown is almost half, at 43% for the strategy versus almost 83%. The strategy alpha is 11.28% per year.
Data from S&P Global via Portfolio123
That said, it is important to note that the correlation between this quantitative strategy and QQQ itself is not very high at 0.38. If you are looking for a quantitative strategy that can closely track the QQQ ETF, then this is clearly not the best choice.
Besides, this new version of the strategy can significantly underperform versus buy and hold over different periods. The table below compares some return and risk statistics for the strategy versus QQQ over different timeframes.
| Return | Strategy | QQQ |
| Annualized | 14.37% | 7.70% |
| One Year | 6.24% | 26.90% |
| Total | 1533.54% | 368.27% |
| Risk | ||
| Sharpe Ratio | 0.62 | 0.33 |
| Sortino Ratio | 0.96 | 0.44 |
| Max Drawdown | -43.62% | -82.98% |
| Standard Deviation | 21.90% | 24.34% |
| Correlation | 0.38 | - |
| R-Squared | 0.15 | - |
| Beta | 0.34 | - |
| Alpha (annualized) | 11.28% | - |
Data from S&P Global via Portfolio123
It is interesting to note that the quantitative strategy is underperforming by a wide margin in the past year. This is because high momentum stocks have been quite volatile through 2019, and also because the hedging position had a negative impact on performance during January and February.
This discrepancy in performance should be expected. Even the best strategies, meaning the ones with the best risk and returns numbers over the long term, generally go through painful periods of underperformance over shorter timeframes.
The trend and momentum factors are going to outperform when the market alternates big bull and bear markets. On the other hand, in a market environment in which prices are moving mostly higher and short-term pullbacks are buying opportunities, a strategy such as this one can be expected to underperform versus buy and hold.
The Bottom Line
No strategy, quantitative or discretionary, can be expected to outperform all of the time and in all kinds of environments. For investors who are looking to control for downside in QQQ, a trend following approach makes a lot of sense if you want to reduce the risk of big drawdowns over the long term.
Adding some momentum to the strategy at the individual stock level makes performance much more unpredictable, and the results can be very different from a buy and hold position in the QQQ ETF itself. However, both risk and return can be substantially improved by this combination of trend following and momentum in QQQ.
In case, you were wondering, the strategy is currently unhedged, since QQQ is currently trading well above the 200-day moving average.
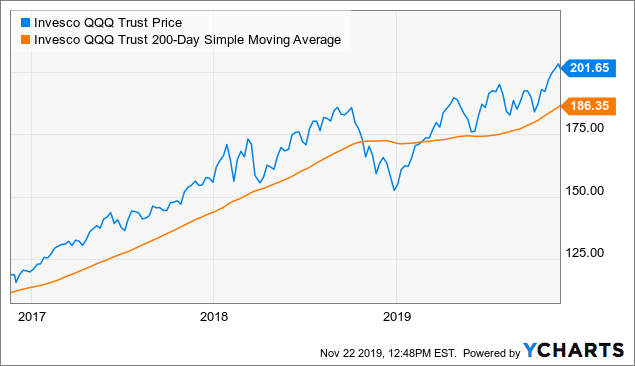
Data by YCharts
Offering more information, the table below shows the 20 positions in the QQQ based on their Stocks on Fire rankings. Data in the table includes the Stocks on Fire ranking and market capitalization value in millions for the companies selected by the algorithm.
| Name | Ticker | Ranking | Mkt Cap |
| Applied Materials Inc. | AMAT | 98.98 | $52,137 |
| KLA Corp. | KLAC | 97.96 | $25,547 |
| Lam Research Corp. | LRCX | 96.94 | $38,231 |
| Apple Inc. | AAPL | 95.92 | $1,164,172 |
| Charter Communications Inc. | CHTR | 94.9 | $101,945 |
| Lululemon Athletica Inc. | LULU | 93.88 | $28,242 |
| Microsoft Corp. | MSFT | 92.86 | $1,141,130 |
| Intel Corp. | INTC | 91.84 | $253,257 |
| Skyworks Solutions Inc. | SWKS | 90.82 | $16,399 |
| Fiserv Inc. | FISV | 89.8 | $77,666 |
| Vertex Pharmaceuticals Inc. | VRTX | 89.8 | $55,441 |
| Advanced Micro Devices Inc. | AMD | 87.76 | $44,025 |
| Ross Stores Inc. | ROST | 86.73 | $40,487 |
| Amgen Inc. | AMGN | 85.71 | $135,826 |
| NetEase Inc. | NTES | 84.69 | $37,670 |
| O'Reilly Automotive Inc. | ORLY | 83.67 | $32,937 |
| Facebook Inc. | FB | 82.65 | $564,892 |
| Align Technology Inc. | ALGN | 81.63 | $21,447 |
| Cintas Corp. | CTAS | 81.63 | $26,216 |
| Costco Wholesale Corp. | COST | 79.59 | $132,006 |
Trend following and momentum are not for everyone. They are most suited for aggressive investors who are willing to implement investment strategies with highly unpredictable returns in the short term. Personally, I like to include aspects such as the fundamental quality of the business and the stock valuation in the stock selection process, since this gives me more confidence in the selections over the long term.
That said, the evidence is quite clear, winners tend to keep on winning in the stock market, and a trend following approach in combination with momentum at the individual stock level can significantly improve performance in QQQ.
Disclosure: I am are long FB.
Disclaimer: I wrote this article myself, and it expresses my own opinions. I am not receiving compensation for it. I have no business relationship ...
more

