
Bitcoin Falls Hard Following A 25.5% Rally
Bitcoin (BTC/USD) falls hard (at least 11%) following a $850.92 or 25.5% rally off the $3,337.87 swing low from 26 days ago.
A high of $4,188.79 was reached before resistance took hold and turned Bitcoin down as momentum rose. That resistance level is in the area of a 1.618 Fibonacci projection of a rising ABCD advance at 4,134.08, and just shy of the critical $3,945 swing high resistance from late-December. In addition, the 100-day moving average is close by, along with a Modified Schiff Pitchfork line resistance. Further, the 14-day RSI was the most overbought since July 2018.
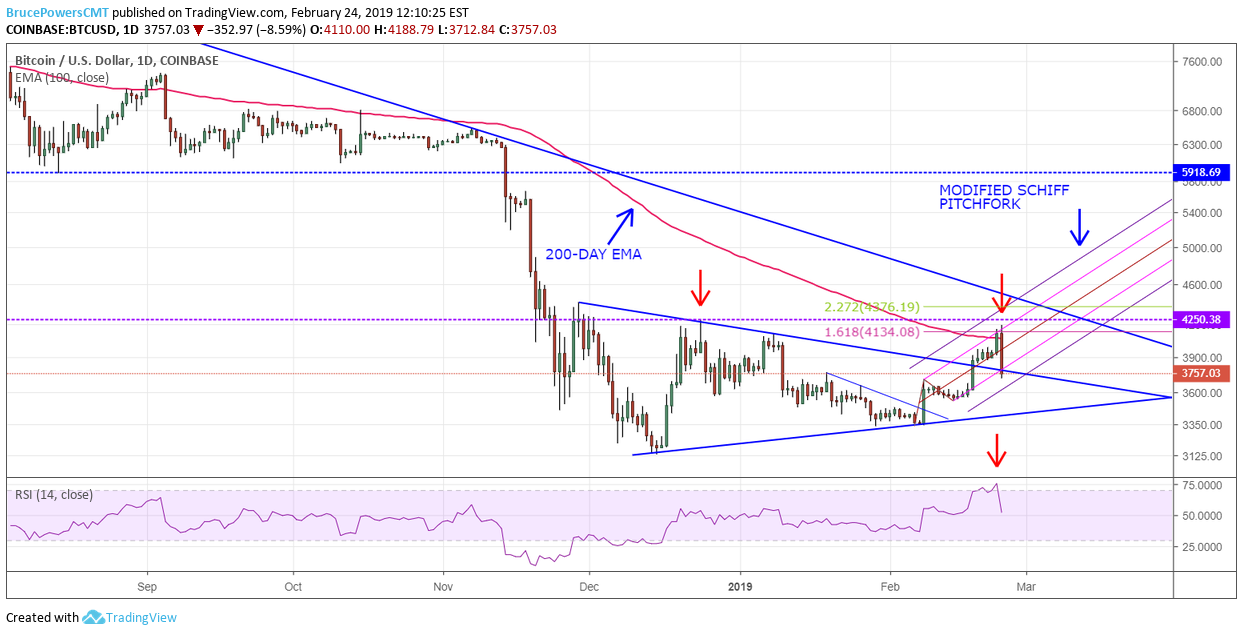
A daily close above the December swing high was needed to confirm strength from the bullish breakout of a large symmetrical triangle bottom that occurred on February 18. As of this post, Bitcoin has pulled back to potential support around the top downward sloping trend line defining the symmetrical triangle (resistance becomes support). It remains to be seen whether that potential support zone will hold or if a deeper retracement into the consolidation pattern takes place.
Nevertheless, a breakout of the symmetrical triangle would indicate the potential for another leg up eventually, off the December trend low of $3,129. That move would have the potential to decisively breach the December swing high. At the same time, an expansion of the consolidation pattern could also occur.
Disclosure: Above analysis is for educational purposes only. Proceed at your own risk. All information given here is largely based on technical analysis and the analysis is very dynamic in nature and ...
more

