
Can Trading Be Reduced To Cycles, Stresses And Vibrations?
[Editor's note: StockSpotter.com is a system for trading stocks and commodity futures. John Ehlers is a well-known commodities trader and the creator of MESA, a method of cycle analysis that he developed in the late 1970s. He is a recipient of the Market Technicians Association (MTA.org) Charles H. Dow award and has written four books about trading, including Rocket Science for Traders. John is also the co-founder with Ric Way of StockSpotter and developer of its proprietary formulas and indicators — the subject of his interview with TalkMarkets contributor, Ilene Carrie.]*****
Ilene: John, it’s fascinating that you use cycles to predict the behavior of stocks. I understand it’s been a life long study for you and I don’t know the first thing about it. So, could you give me a quick introduction about how, and on what basis, your system predicts the movement of stocks?

John: Cycles are everywhere in nature, from the four seasons, to the ringing of a bell, to the vibrations of a violin string, and so forth. It is natural that we would have cycles in the market because there are plenty of stresses that can cause the prices to ring out. They can vary with the presidential elections, seasonals, triple witching, or just the companies having to make their numbers on quarterly or monthly basis. However I don’t imply causality, and view market cycles as ephemeral – they come and go with no apparent reason.
I effectively measure the general cycles without implying a cause. Once I measure the cycle and determine where the prices lie within that cycle, it is a matter of expecting that cycle to continue for a short while into the future that provides a high probability trade event. Of course, I have developed a series of indicators and techniques whose express purpose is to located positions within the cycles and to forecast the nearterm variations.
Ilene: If I understand correctly, your system/software looks at technical factors and decides when there’s a buy signal. Can you briefly summarize in non-technical language what a stock is doing when the buy signal gets triggered?
John: I am very technical, and I design trading tools using these factors. My analogy is that some people make hammers and other people use them. In this sense I am a hammer maker. My job is to provide technical tools that make the job easier for traders and investors. My particular expertise is in information theory and Digital Signal Processing (DSP). I develop filters and indicators based upon what happens in the frequency domain. For example, if I want to follow a trend I will use a very low frequency filter to smooth out the short term variations so I am not distracted by them. My experience is there is a pervasive (approximate) one month cycle present in most stock prices much of the time. Therefore, I mainly focus on cycle periods on the order of one month. That means the cycle has about 10 bars up and 10 bars down. As a result, my trading strategies typically have a time-in-trade of 10 to 12 days. By riding a cycle, I not only know when to enter a trade, but also when to exit it.
Ilene: Do the factors you’re measuring coincide at all with the factors that you would be measuring if you were looking for a “reversion to the mean” sort of behavior from the stocks. Are you predicting that the cycles regularly move back to a mean price target or range?
.jpg)
John: Cycles are a natural reaction to a disturbance. When you strike a bell with a clapper, the bell then rings out its tone. Similarly, if a violinist drags the bow across the strings, those strings vibrate in reaction to the disturbance. In school, if you held a ruler over the edge of the desk, bend it down while holding the other end solidly on the desk, and then release it – the ruler will vibrate. I think you get the idea. Cycles are the system response to a disturbance. The market has plenty of disturbances. The Greece Euro thing recently, for example. I am just saying the market responds to disturbances. However, I do not assign causality to those disturbances (unless they are like the big obvious ones). This means I don’t think things like planetary motion cause market cycles. Nor do I think that the cycles are constant. They are more noise-like.
So to answer your question, yes. In a statistical sense, I am assessing the short term variation from the long term mean. Basically, I try to predict when mean reversion will occur. The purple “swoosh” on the chart (below) is a graphical prediction of where the prices will go in the next 10 days. By the way, there is a control above the Trade Setup Analyzer chart that lets you move the purple swoosh so you can backtest the prediction.
Without getting lost in all the indicators, I would like to point out that the charts and the signals reinforce each other. StockSpotter.com makes trading easy by providing explicit buy and sell signals for over 4500 stocks.
Ilene: Can you give me an example?
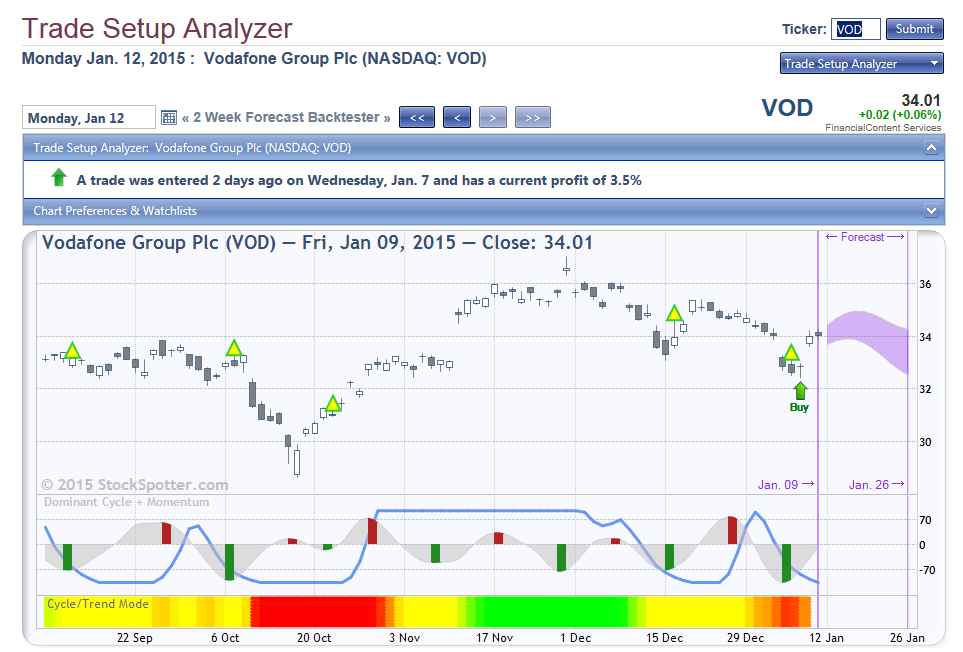
John: Yes, here’s a chart that shows graphically the factors that StockSpotter uses to give signals. A buy signal on Vodaphone (VOD), to be exercised on the open, was given several days ago.
.gif)
The automated decision to buy was created by the combination of the cycle indicator being at a cyclic bottom (flagged by the green bar) and the blue line momentum indicator declining or at a minimum. These conditions create trade setups, which are displayed as the yellow triangles. A trade setup is a necessary, but not sufficient condition for a buy signal. In this case, note that the purple “swoosh” prediction into the future reinforces the trade setup and contributes to the decision to buy. Not every trade setup results in a trade signal.
Here’s a follow up chart for VOD a couple days later, reflecting the closing price on Friday, January 9, 2015.
In the chart below for the ETF GLD, you can see how we recently closed out a profitable trade based on StockSpotter’s signals. Several conditions contribute to exiting a trade. By examining the chart, we can see the cycle indicator is near the top and the prediction into the future is neural to down.

The charts are a way of demonstrating how the trading decisions are made. When a buy signal appears, you can see the trade setup that occurred prior to the signal and visualize how the chart anticipates the cycle bottom followed by the upside reversal in momentum. StockSpotter.com gives explicit signals in tabular form at the end of the market day for exercise at the market on the next open. This simplifies and supports trading decisions. Using market prices on the open for both the entry and exit gives an accurate and transparent way to track all trades in history.
Photos credit: Pixabay
Disclosure: None.
Offer for TalkMarkets readers: more


