
How To Use Moving Averages For Swing Trading

Image Source: Pexels
If you have been trading for any length of time, you have probably seen charts cluttered with a dozen indicators. It can feel like trying to fly a spaceship filled with blinking lights and random signals. Many traders fall into the trap of believing more indicators mean more information and better results. I have been there. My early charts looked like modern art. What I learned over time is that complexity is often the enemy of profitability.
The truth is, you do not need a complicated system to succeed. You need a simple, repeatable process that you can execute with discipline. One of the most powerful tools in my trading arsenal has always been the moving average. Their simplicity is their strength. They cut through short-term noise and help reveal the underlying trend. For swing traders, understanding how to properly use a few key moving averages is foundational.
(Click on image to enlarge)
The Big Three Moving Averages for Swing Trading
You can add countless moving averages to a chart, but I focus on three that give me everything I need to understand trend health and direction: the 20-day, 50-day, and 200-day simple moving averages.
The 20-day SMA is my short-term trend guide. It closely follows price and reflects immediate momentum. When price trades above it, short-term momentum is bullish. When below it, momentum is bearish. I often use this moving average to manage active trades and identify pullback entries.
The 50-day SMA represents the intermediate-term trend and is one of the most important levels on a swing trader’s chart. Many institutions watch this level closely. In strong uptrends, stocks often pull back to the 50-day SMA and find buyers. A decisive break below it on volume can signal a meaningful change in trend.
The 200-day SMA defines the long-term trend. It is the line in the sand separating bullish and bearish conditions for many traders. While some only trade stocks above it, I will still trade below the 200-day if market conditions and risk management allow and price is not likely to immediately collide with that level.
I also use the 5-day and 10-day SMAs as momentum gauges once I am already in a trade. These help me evaluate whether a breakout or bounce still has energy behind it.
Using Moving Averages to Define Setups
With these moving averages on your chart, you can build a clear framework for identifying high-probability setups. I never look at moving averages in isolation. I focus on how they align with each other and how price has historically reacted to them.
One important rule: do not treat a moving average as support or resistance unless the chart has proven that it matters. If price has never respected that level before, assigning importance to it is meaningless.
For example, a break above a declining 20-day SMA after repeated rejections can signal a change in character. But even then, the broader chart structure and risk management must align before taking the trade.
The Crossover: A Signal of Change
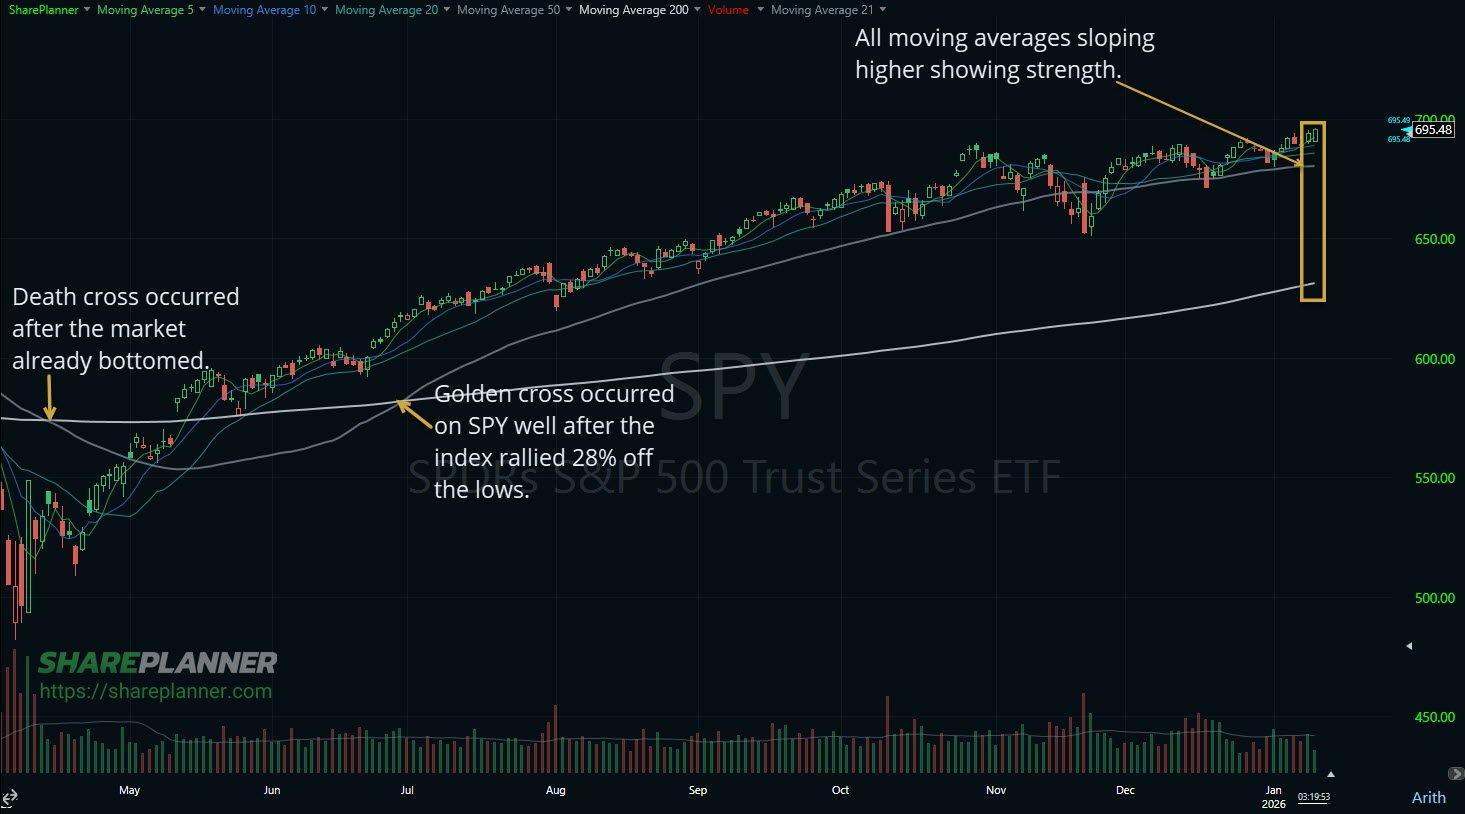
Moving average crossovers are popular, but they tend to be lagging signals. The well-known Golden Cross, where the 50-day crosses above the 200-day, often occurs after a large portion of the move has already happened. The Death Cross signals the opposite, but it too lags price.
Despite this lag, these crossovers provide valuable context. I am far less interested in initiating long trades after a Death Cross. Conversely, a Golden Cross gives me confidence to focus on long setups.
Shorter-term crossovers can be more useful. A 20-day SMA crossing above the 50-day after consolidation can act as an entry trigger, especially when confirmed by rising volume. Volume is what validates the signal.
Avoiding Whipsaws in Choppy Markets
Moving averages work best in trending markets. In sideways conditions, they flatten out and frequently cross, creating false signals known as whipsaws.
The slope of the moving averages matters. Flat 50-day and 200-day SMAs usually indicate range-bound conditions. During these periods, I avoid trend-following strategies and often stay on the sidelines.
Sometimes the best trade is no trade at all. When moving averages are tangled together, capital preservation becomes the priority.
What It All Means
Mastering moving averages is not about finding a perfect setting. It is about understanding what they reveal about trend, momentum, and risk.
Start with the 20-day, 50-day, and 200-day SMAs, then incorporate the 5-day and 10-day over time. Watch how price behaves around these levels. Use them to define entries, stops, and exits. Respect their limitations, especially in choppy markets.
A simplified approach built around moving averages provides a strong foundation for disciplined swing trading and long-term consistency.
Frequently Asked Questions About Moving Averages
Which moving averages are best for swing trading?
For swing trading, the most commonly used moving averages are the 20-day, 50-day, and 200-day simple moving averages. Together, they help define short-term momentum, intermediate trend, and long-term direction.
Are moving averages lagging indicators?
Yes, moving averages are lagging indicators because they are based on past price data. However, they are still valuable because they help identify trend direction, manage risk, and filter low-probability trades.
Should I trade moving average crossovers?
Moving average crossovers can provide useful context but are often late signals. Shorter-term crossovers, such as the 20-day crossing above the 50-day, can be more effective when confirmed by volume and prior price behavior.
Why does price often react at the 50-day moving average?
The 50-day moving average is widely watched by institutions. In strong trends, price frequently pulls back to this level as buyers step in, making it an important area for potential support or resistance.
Do moving averages work in sideways markets?
Moving averages are less effective in choppy or range-bound markets. When moving averages flatten and overlap, it often signals poor trend conditions, and swing traders are better off waiting for clarity.
Should I use exponential or simple moving averages?
Both can work, but simple moving averages tend to provide cleaner, more reliable levels for swing trading. The key is consistency rather than switching between types.
More By This Author:
Visa Testing A Trend-Line
SCOTUS & Trump’s Tariffs: Preparing For The Verdict
TSLA Stock Analysis: Is Tesla’s Pullback A Buy Or A Breakdown?


