
How To Be A Great Investor, Part Eight: Know The Difference Between Information And Influence
This article is the eighth in a ten-part series loosely based on Michael J. Mauboussin’s white paper “Thirty Years: Reflections on the Ten Attributes of Great Investors.” See “Part One: Be Numerate,” “Part Two: Understand Value,” “Part Three: Properly Assess Strategy,” “Part Four: Compare Effectively,” “Part Five: Think Probabilistically,” “Part Six: Update Your Views Effectively,” and “Part Seven: Beware of Behavioral Biases” for previous installments. And please keep in mind that although I’m basing my work on Mauboussin’s, I am departing from his ideas on occasion.
Mauboussin breaks down two functions of the price of a stock. First, it tells us (gives us information about) how much the market believes a stock is worth. Second, it acts as an influence upon buyers: if a price is rising, people want to get in on the rise and buy; if a price is falling, investors are more likely to want to sell. The task of a great investor is to learn how to separate the two, subscribe only to the information, and ignore the influence. I’ll let Mauboussin explain:
Investing is an inherently social exercise. As a result, prices can go from being a source of information to a source of influence. This has happened many times in the history of markets. Take the dot-com boom as an example. As internet stocks rose, investors who owned the shares got rich on paper. This exerted influence on those who did not own the shares and many of them ended up suspending belief and buying as well. This fed the process. The rapid rise of the dot-com sector was less about grounded expectations about how the Internet would change business and more about getting on board. Negative feedback ceded to positive feedback, which pushes a system away from its prior state.
I’d like to look at the difference between information and influence in a more scientific, less anecdotal manner. Let’s look at companies that experienced a change in price in a four-week period that was 20% more than that of the benchmark. We’ll limit this experiment to the Russell 3000 and exclude biopharma companies, as these big price jumps are common when a drug is approved or shut down. And we’ll only look at stocks whose latest earnings release was over four weeks ago and whose next earnings release is over four weeks away. The source of my research is www.Portfolio123.com.
If information prevails, we should see a large percentage of these companies revert to their former prices; if influence prevails, we should see the new prices sticking.
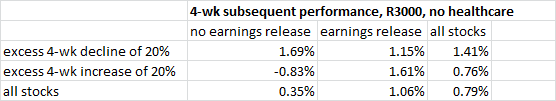
Over the last twenty years, stocks from this group whose price has risen 20% more than the benchmark see an average decline of 0.83% in the next four weeks (compared to an increase of 0.79% for all stocks); stocks that have declined 20% see an average increase of 1.69% in the next four weeks.
Now let’s classify price changes based on earnings releases as information and price changes not based on earnings releases as influence. This is, of course, too broad a classification—there is plenty of information happening between earnings releases, and some of the hoopla surrounding earnings releases should be classified as influence or noise. But let’s keep things simple for the moment. If information is more relevant than influence, major price changes that happen right after earnings releases should be stickier than major price changes between earnings releases.
I’ve already given you the numbers for the stocks with major price changes between earnings releases—they tend, on the whole, to revert. But stocks with major price changes around earnings releases act differently. Those with an excess 20% jump in the four weeks that include an earnings release tend to gain an additional 1.61% over the next four weeks; stocks with an excess 20% loss tend to mean revert with a 1.15% gain, but this is significantly less than the mean reversion of stocks that have dropped 20% without an earnings release (1.69%), and significantly less than all stocks with an excess decline of 20% (1.41%).
Here are the numbers:
Just to make the difference even clearer, here are all those numbers annualized.

Now, obviously, there are far more sophisticated ways to look at large price changes than whether or not they’re related to earnings announcements. But I wanted to give you these numbers to emphasize the main point: when you’re looking at a change in the price of a stock, it’s very important to try to figure out whether it’s related to the underlying value of the stock or if it’s just noise/influence. If it’s the latter, the price change is much more likely to revert.
Too many investors look only or primarily at the price of a stock. But because the price of a stock reflects a huge amount of information about it, it’s not going to give you many clues as to whether it’s going to rise or fall.
There are two ways to capitalize on the price of a stock—when you believe that the information informing the price is wrong and when you believe that the price is based on noise or influence rather than on the information. Both of these are very difficult projects.
Because public companies have to disclose so much information, and because the SEC is pretty good at policing it, it’s difficult to find instances of the information being wrong. And differentiating information from influence can be quite difficult. If a stock you’re interested in seems quite cheap or expensive and there’s very little to indicate why it’s so cheap or expensive, will a recent price move tell you much? Probably not.
But there is a third way to make money on stocks: to anticipate changes in information. And the best way to do this is to look at what the company is actually doing rather than looking at its price. I’m not saying one should disregard the price altogether, but examining how a company is allocating its capital, looking at its patterns of revenue generation, tracing its cash flow, and so on can indicate to a savvy investor what price future information might justify.
CAGR since 1/1/16: 32%.
My top ten holdings right now: IESC, NRC, ELMD, MHH, CO, INFU, ACU, SPNS, WSTG, CMCL.


