
How Diversification Works
I’m going to let you in on a little secret. For the first time in my investing career, I’m aggressively adding gold to my portfolio.
I’m not betting the farm on it, and I still have most of my cash in stock and options trading strategies. But in today’s macro climate, I think it only makes sense to add the yellow metal to the mix.
This brings up one of the most misunderstood concepts in investing: diversification. Today, we’re going to discuss how diversification works.
How Diversification Works
You understand the timeless wisdom of not putting all of your eggs in one basket. And that’s certainly a big part of how diversification works. But it’s more than that.
It comes down to correlation or the degree to which two stocks or strategies move together. A correlation of one means the two move together in lockstep. A correlation of zero means they don’t move together at all.
And a correlation below zero means they actually move in opposite directions — when one goes up, the other goes down.
If you’re diversifying the right way, you’re looking for correlations as close to 0 as possible. But anything less than one is helpful.
And here’s why.
When you invest in multiple strategies that aren’t tightly correlated with each other, your risk and returns are not the average risk and return of the individual strategies. The sum is actually greater than the parts. You get more return for a given level of risk, or less risk for a given level of return.
Take a look at the graph below.
(Click on image to enlarge)
This is a hypothetical scenario, so don’t focus on the precise numbers. I literally just made them up. But know that it does work like this in the real world.
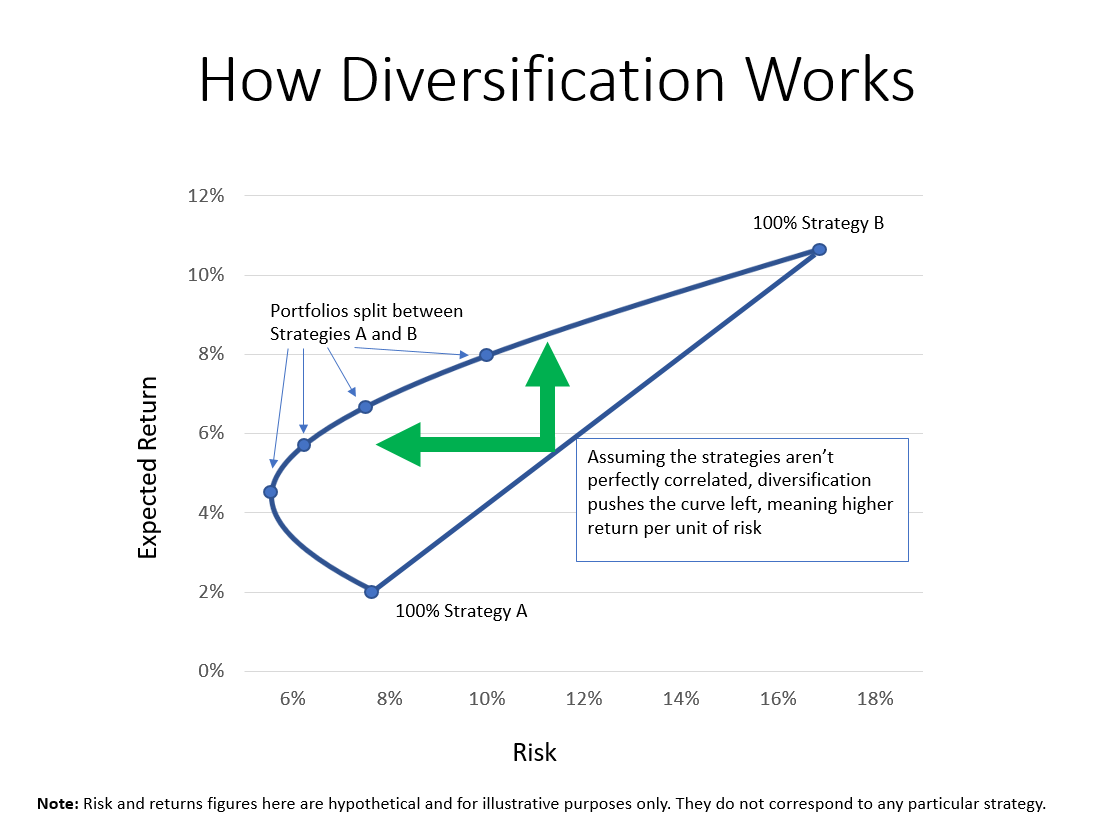
Strategy A is a low-risk, low-return strategy. Strategy B is higher return, higher risk.
In a world where strategies A and B are perfectly correlated (they move up and down together), any combination of the two would be a simple average.
If A returned 2% with 8% volatility and B returned 11% with 16% volatility, a portfolio invested 50/50 between the two would have returns of 6.5% with 12% volatility.
That is what you see with the straight line connecting A and B. Any combination of the two portfolios would fall along that line (assuming perfect correlation).
But if they are not perfectly correlated (they move at least somewhat independently), you get a curve. And the less correlation, the further the curve gets pushed out, meaning more return for a given level of risk.
The dot on the curve shows an expected return of about 8% and risk (or volatility) of 10%. On the straight line, that 8% curve would have a volatility of about 14%, not 10%. And accepting 10% volatility would only get you a return of about 4% on the straight line.
This is why you diversify among strategies. Running multiple good strategies at the same time lowers your overall risk, and boosts your returns. The key is finding good strategies that are independent.
Running the same basic strategy five slightly different ways isn’t how real diversification works, and neither is owning five different index funds in your 401(k). Diversification is useless if all of your assets end up rising and falling together.
Active trading strategies can also offer the same benefits. You don’t have to dump your index funds and embrace active trading.
But incorporating a little active trading into the mix can actually lower your overall risk… so long as your trading doesn’t move in lockstep with the market!
Disclaimer: This material is provided for informational purposes only, as of the date hereof, and is subject to change without notice. This material may not be suitable for all investors and is not ...
more

