
Major Risk Of Monetary System Collapse In 2016 – Got Gold?
The main reason to buy gold and silver any time is as insurance against extreme negative events…The main reason for buying gold in 2016 remains the risk of an international monetary system collapse. Gold is money in extremis…
The main reason for buying gold in 2016 remains the risk of an international monetary system collapse. It hasn’t happened yet but events in 2015 make my case of a collapse not weaker, but stronger. When you hear people like:
- the past chairman of the U.S. Fed (Ben Bernanke) saying, “the system is incoherent”, and
- the former governor of the Bank of Canada and present governor of the Bank of England (Mark Carney) who remarked, in a December 2011 speech that, “the global Minsky moment has arrived”, you have to be prudent at least. Those are not your typical fear mongering people but those in charge of the financial system.
- Several U.S. Fed governors have also admitted that we are in “unchartered territory”, that central bank policies are “experimental” and that they learn as they go along. Journalists even found that one U.S. Fed governor was holding gold for himself in his investment portfolio…
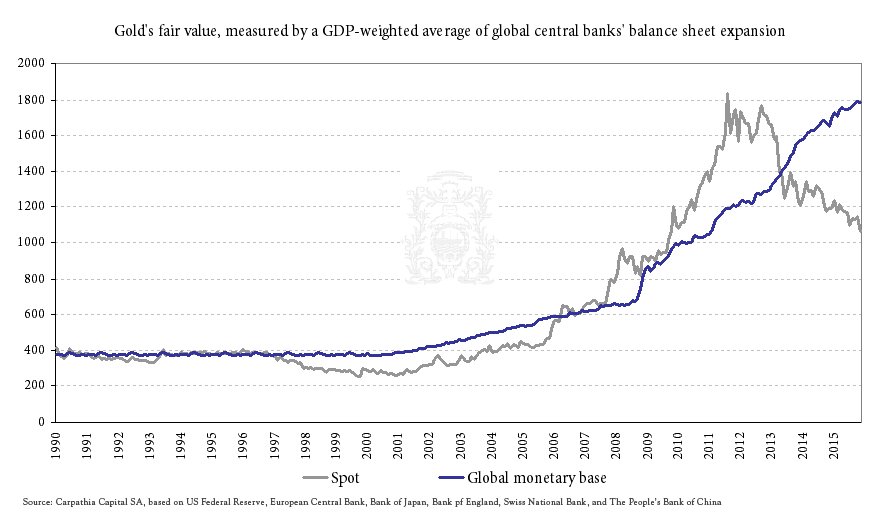
I became bullish on gold in 2004 based on research on global debt and, more specifically, U.S. debt. The 2008 financial crisis confirmed my hypothesis of a major secular reset of the international monetary system. The balance sheet expansion of global central banks is clearly seen in the chart below and its close correlation, even if not perfect, with the price of gold.
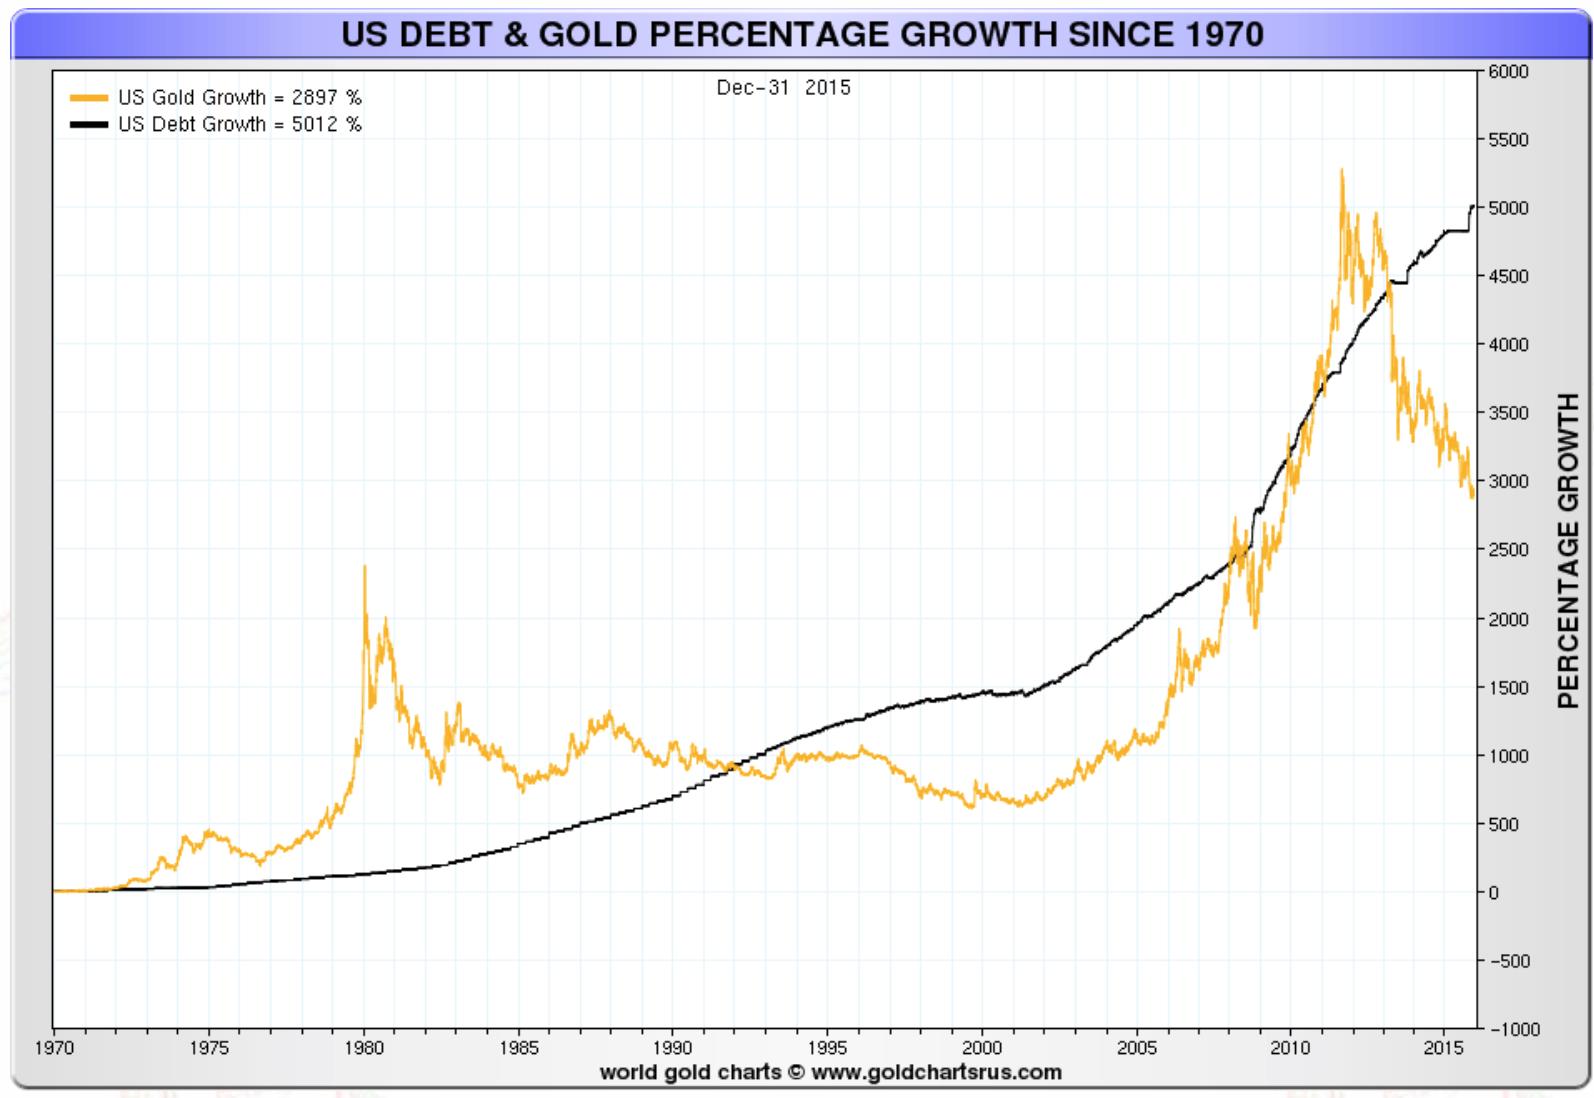
In the next chart below we can see the close correlation of gold also with U.S. debt. The U.S. Congress approved legislation at the end of the year to increase the debt limit even more, again to allow more debt.
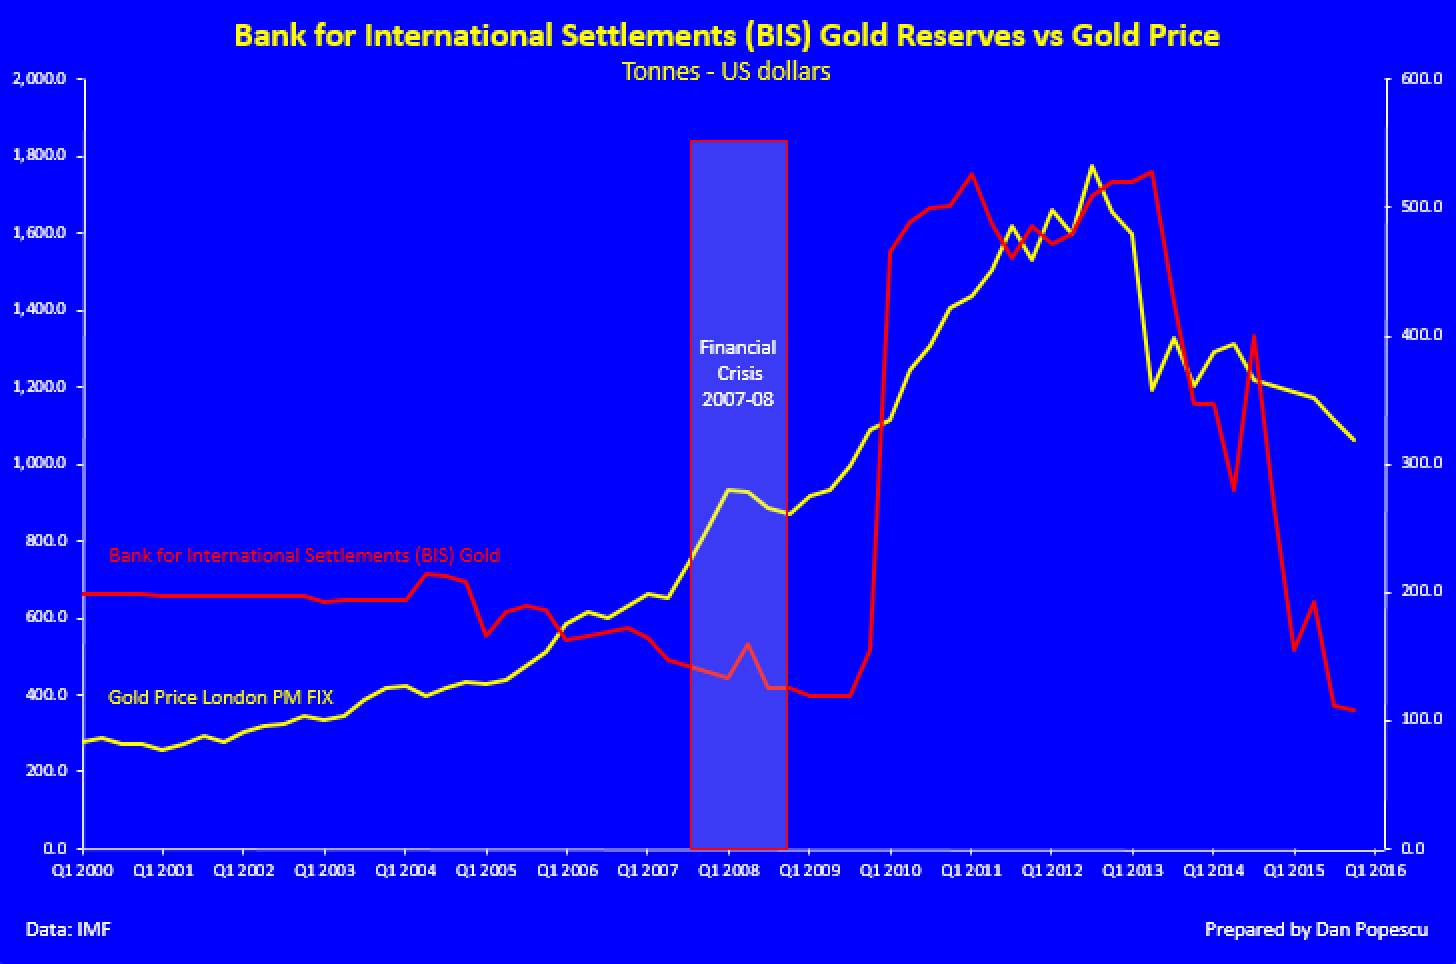
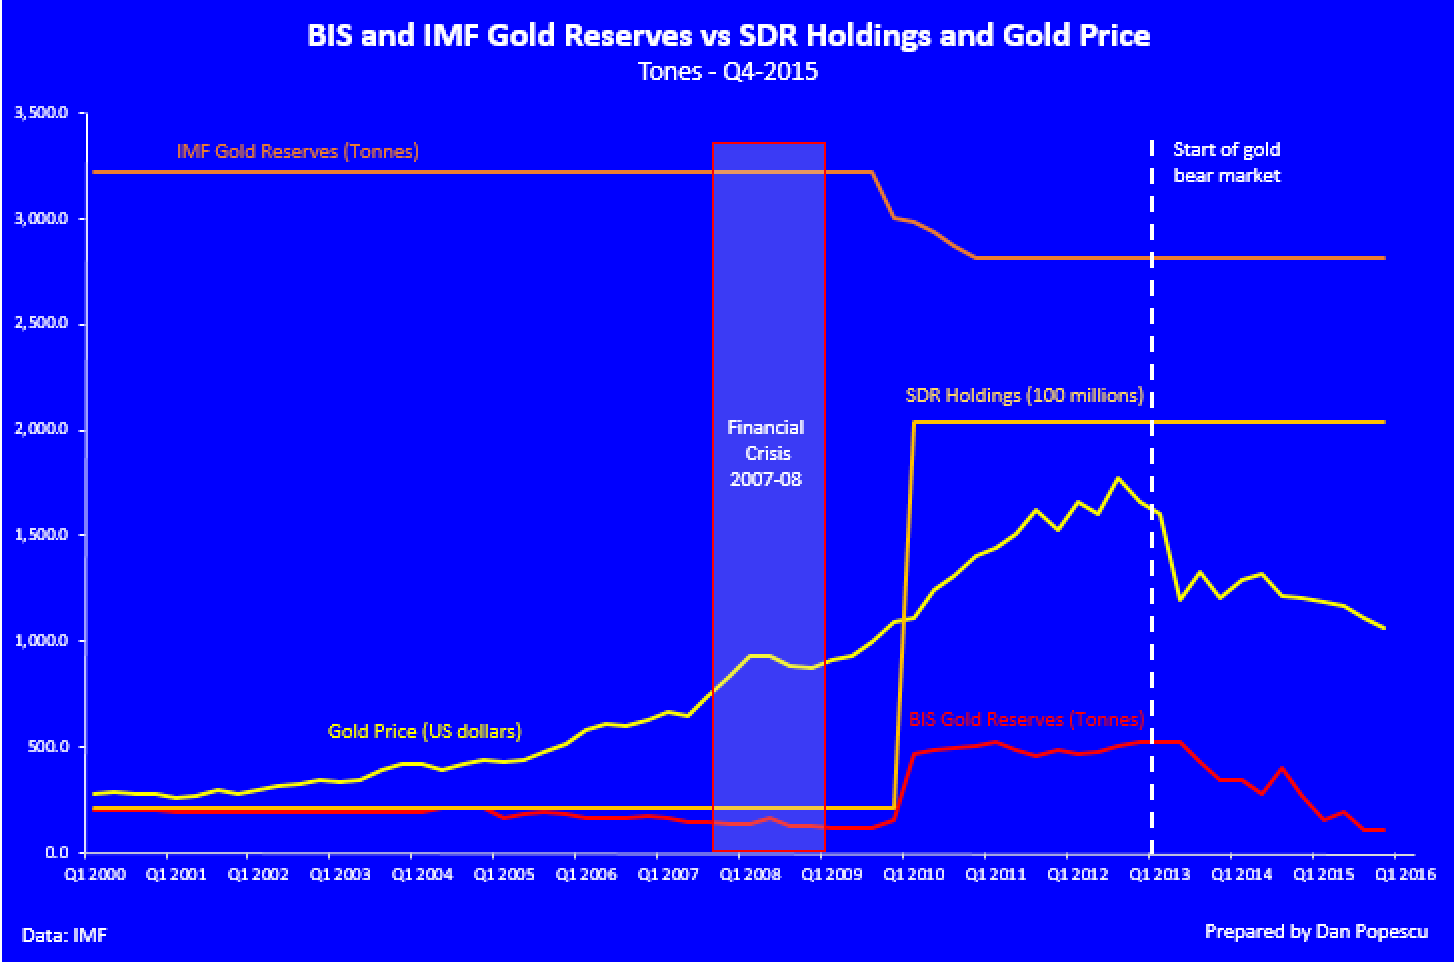
The recent divergence between U.S. debt and global central banks’ balance sheets vs gold is, in my view, mostly due to the manipulation of the gold price by central banks starting in the ‘60s with the London Gold Pool and that continued since then. Observe in the two charts below the close correlation between the sales of gold by the Bank for International Settlements (BIS) and the price of gold. As you can see, the gold bear market coincides with the sale of gold reserves by the International Monetary Fund (IMF), which was done through BIS in Basel, Switzerland, right after the 2008 financial crisis. At the same time, the IMF has increased its SDR holdings ten-fold.
According to the IMF, the first phase in the IMF’s gold sales was exclusively off-market transactions to interested central banks and other official holders, at market prices. In October and November 2009, the Fund sold 212 metric tons of gold in separate off-market transactions to three central banks: 200 metric tonnes were sold to the Reserve Bank of India, 2 metric tonnes to the Bank of Mauritius, and 10 metric tonnes to the Central Bank of Sri Lanka.
…In February 2010, the IMF announced the beginning of sales of gold on the market. At that time, a total of 191.3 tonnes of gold remained to be sold. In order to avoid disrupting the gold market, sales were phased over several months. It seems from the charts above that the IMF/BIS sales have ended or are close to the end.
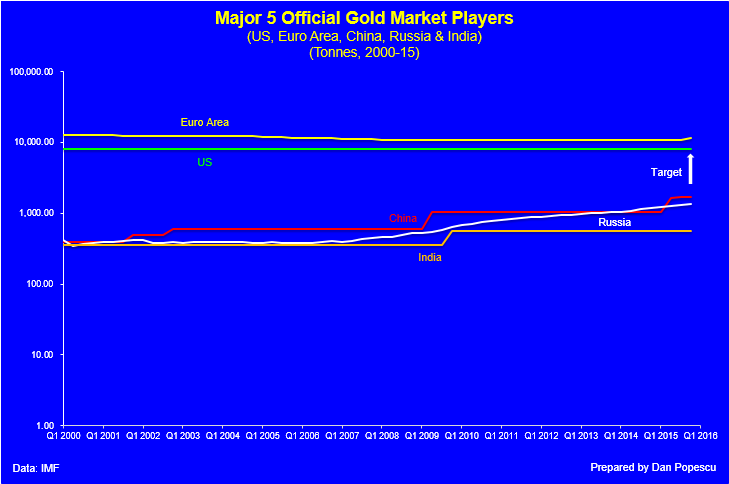
At the same time, we see continued gold buying by China and Russia for their foreign exchange reserves, counteracting Western gold selling. My hypothesis is that China, Russia and also India intend to increase their official gold reserves up to approximately 9,000 tonnes, which is in between U.S. and EU holdings. India is attempting to achieve it by monetizing part of the enormous private and temple gold already in India, estimated to be between 18,000 and 30,000 tonnes. They also bought from the IMF, as mentioned above, 200 tonnes in 2009.
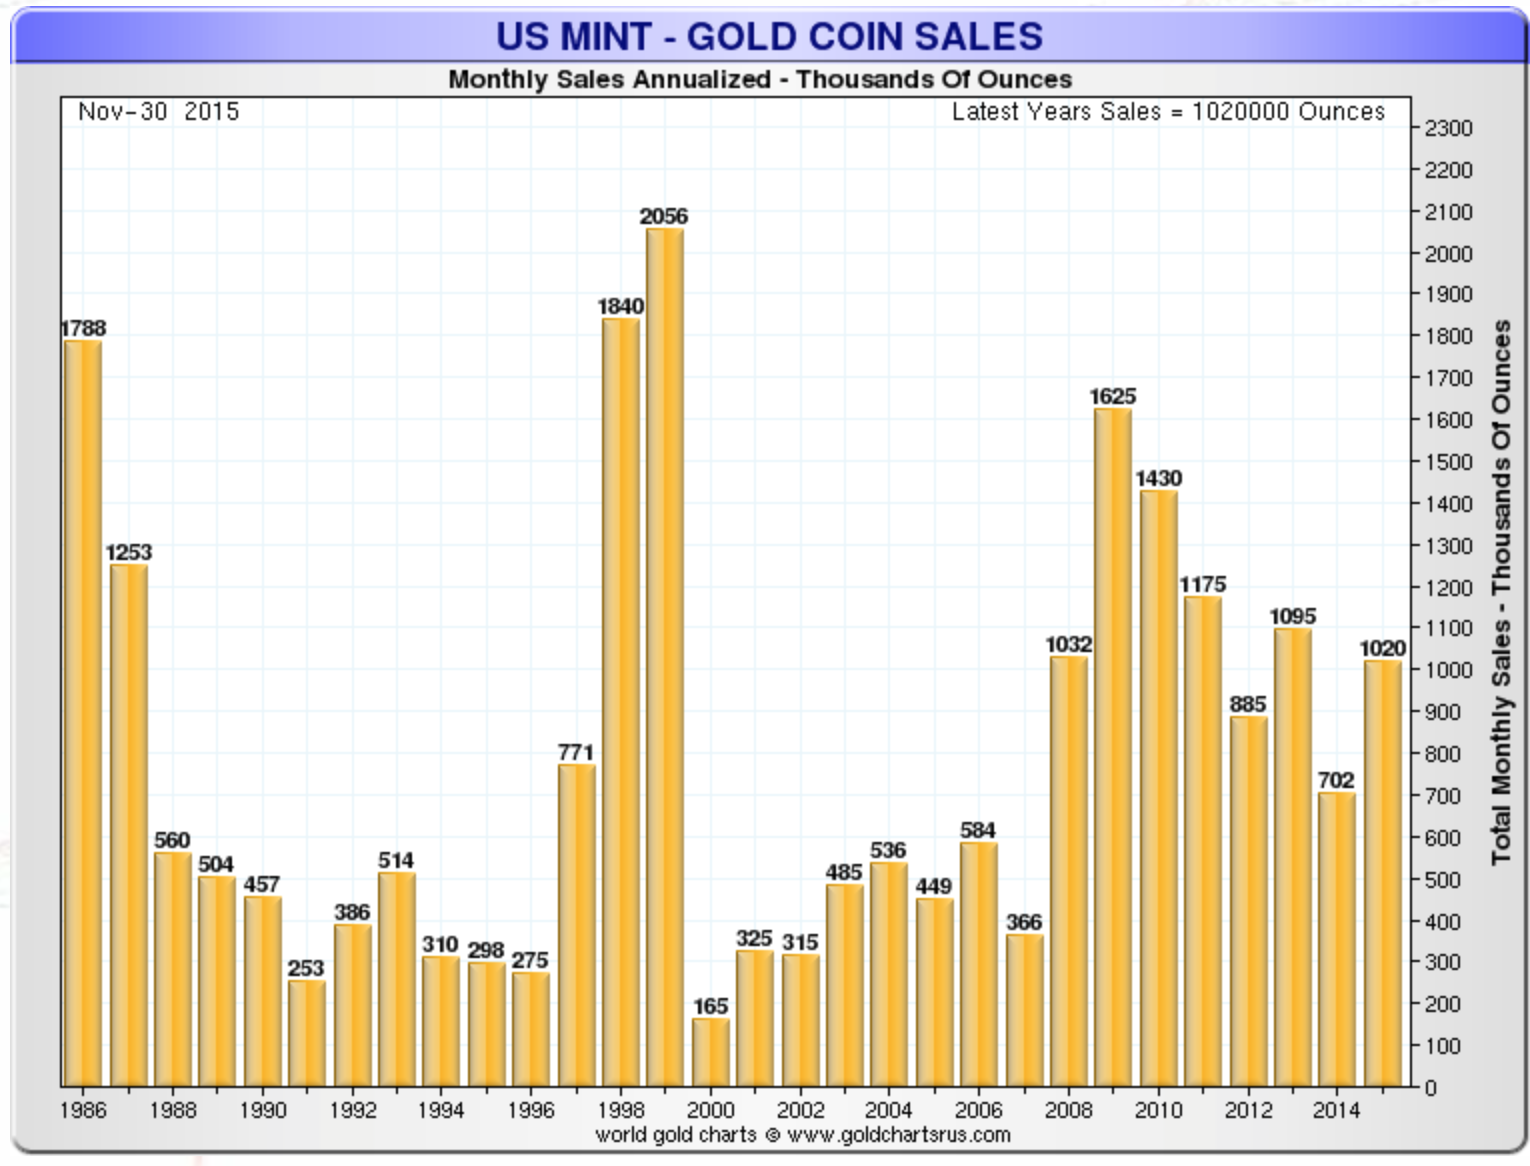
Gold coin buying also has increased all over the world, including North America, since the 2008 crisis, and that despite the recent drop in price. Most of the gold coin demand comes from private individuals and not institutional or official central bank demand.
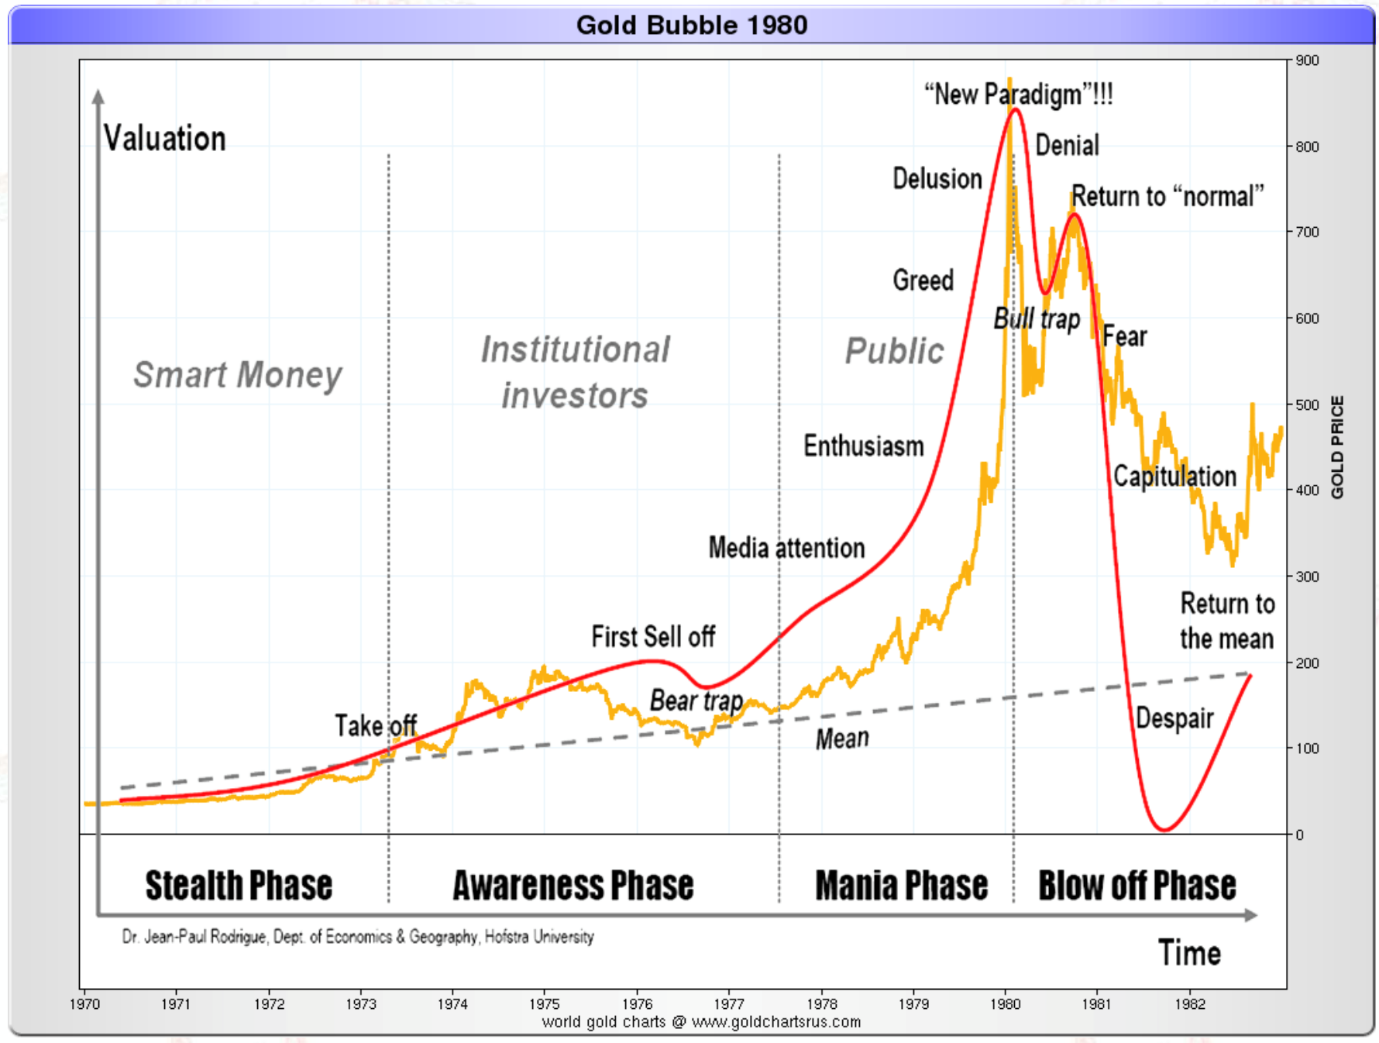
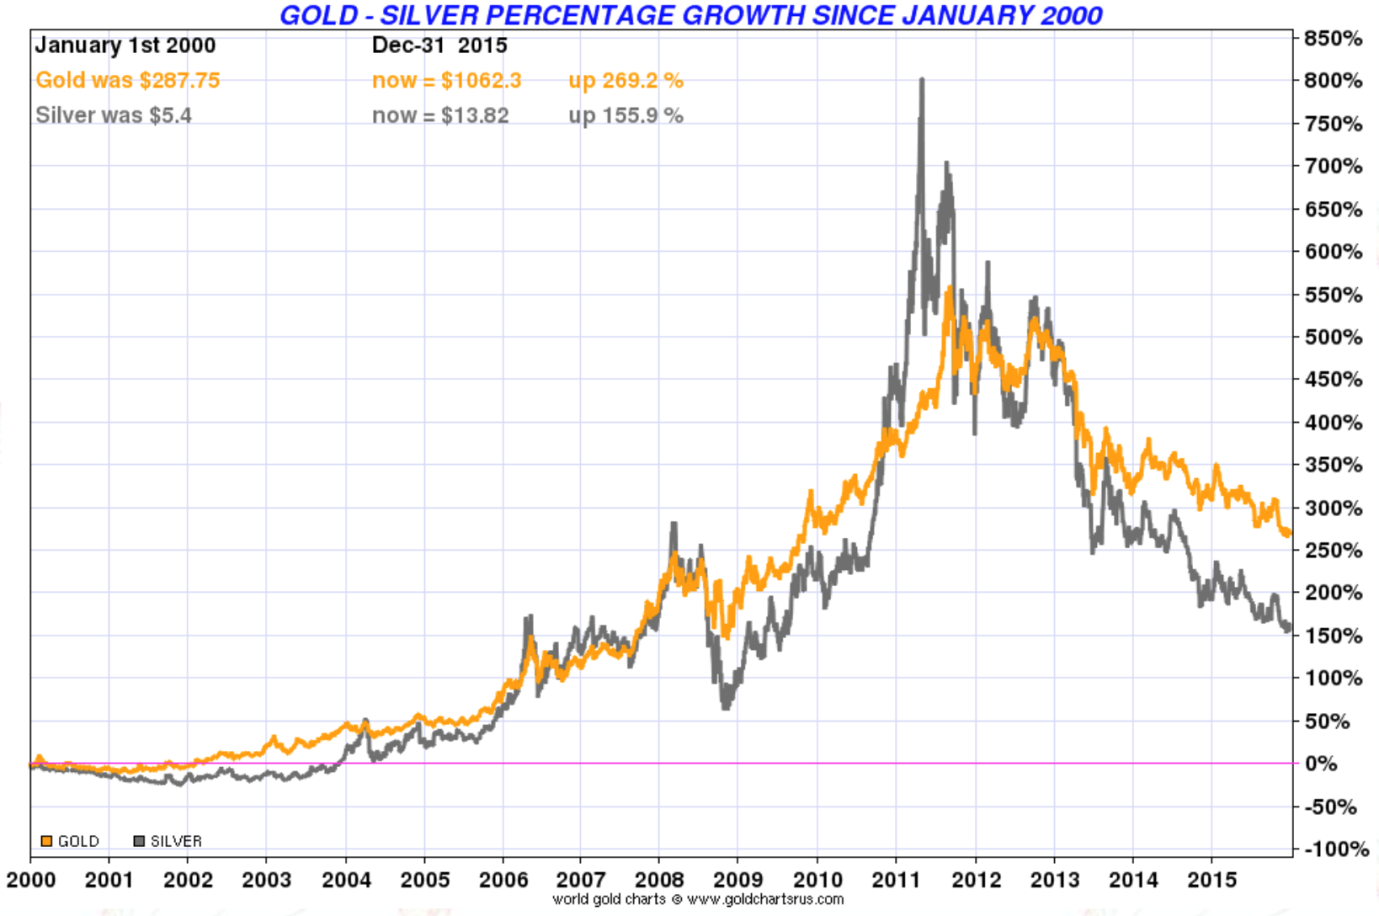
There is a hypothesis that this sideways gold price move we have seen since 2013 is just a correction within a major bear market that will take the price of gold all the way down to the start of the bull market. The bull market started in 2000 at around $250 and ended in 2011 just above $1,900. The target in this scenario, if similar to the ‘70s, would be at least $500. It is a possibility but I give it a very low probability, based on last year’s events. Negative geopolitical and economic developments in 2015 have strengthened my conviction that this scenario is most improbable, but not excluded. Technical indicators also show a very large oversold market not typical of a correction, but more of a bottom.
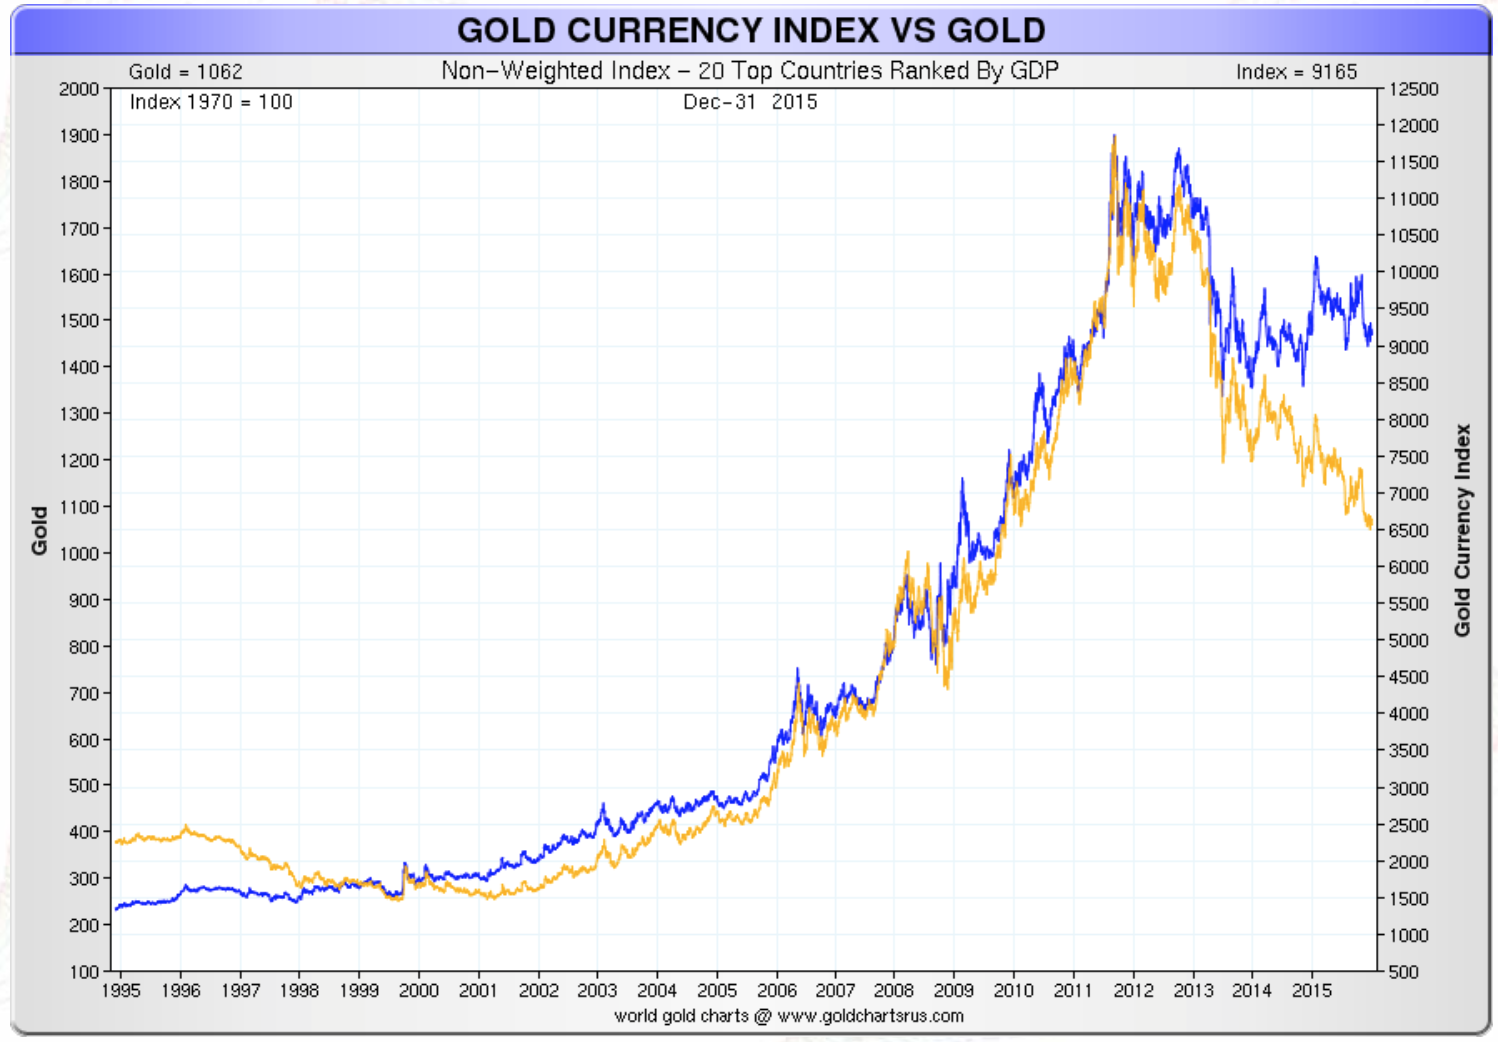
I still believe gold is at the end of a correction within a secular bull market that will take gold to around $5,000 and maybe more. It will end with a reset of the international monetary system. The recent divergence in the price of gold in U.S. dollars versus an index of the top 20 countries’ currencies (based on GDP) will solve itself by the price of gold in dollars converging towards the currency index price, not the other way.
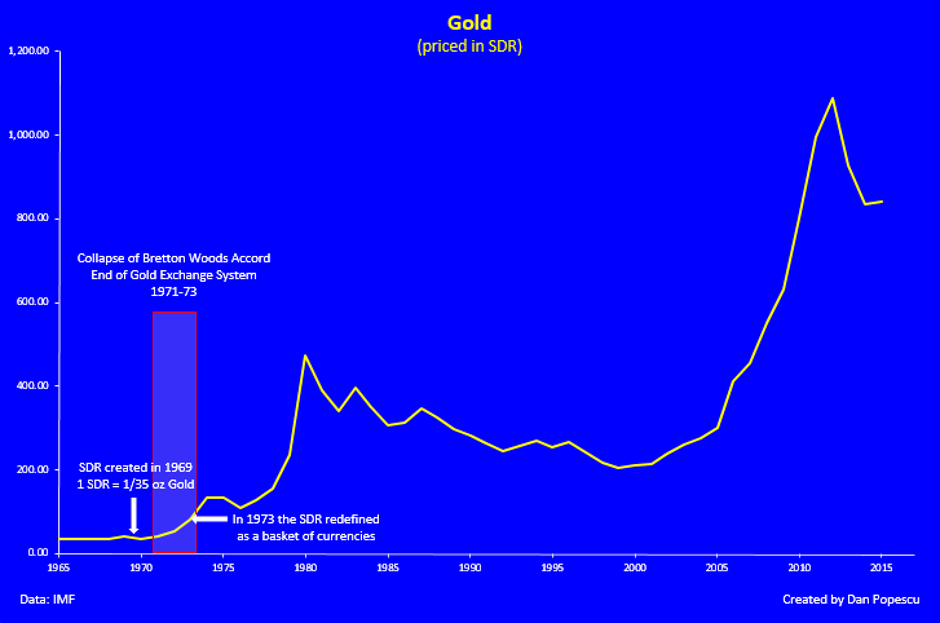
In the chart below you can see that if we look at the price of gold in SDR (basket/index of US dollars, EU euro, British pound and Japanese yen) and compare the recent move since 2000 to the 1970s, the recent move is more a correction within a bull market than a bear market correction.
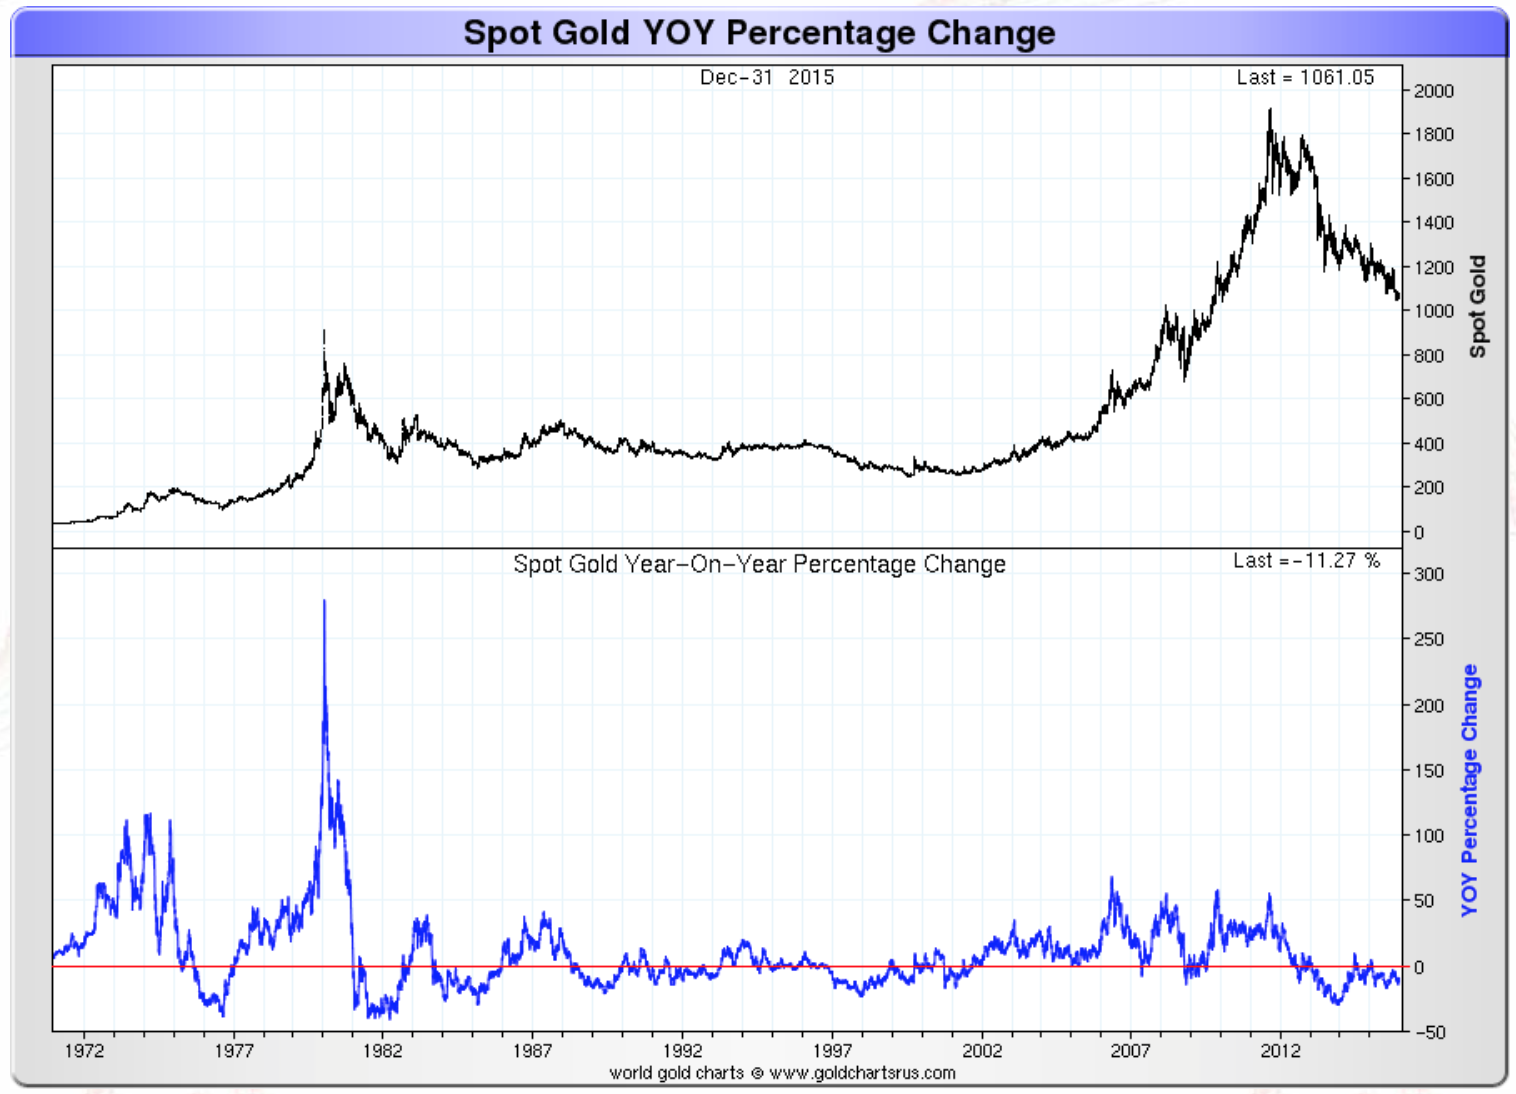
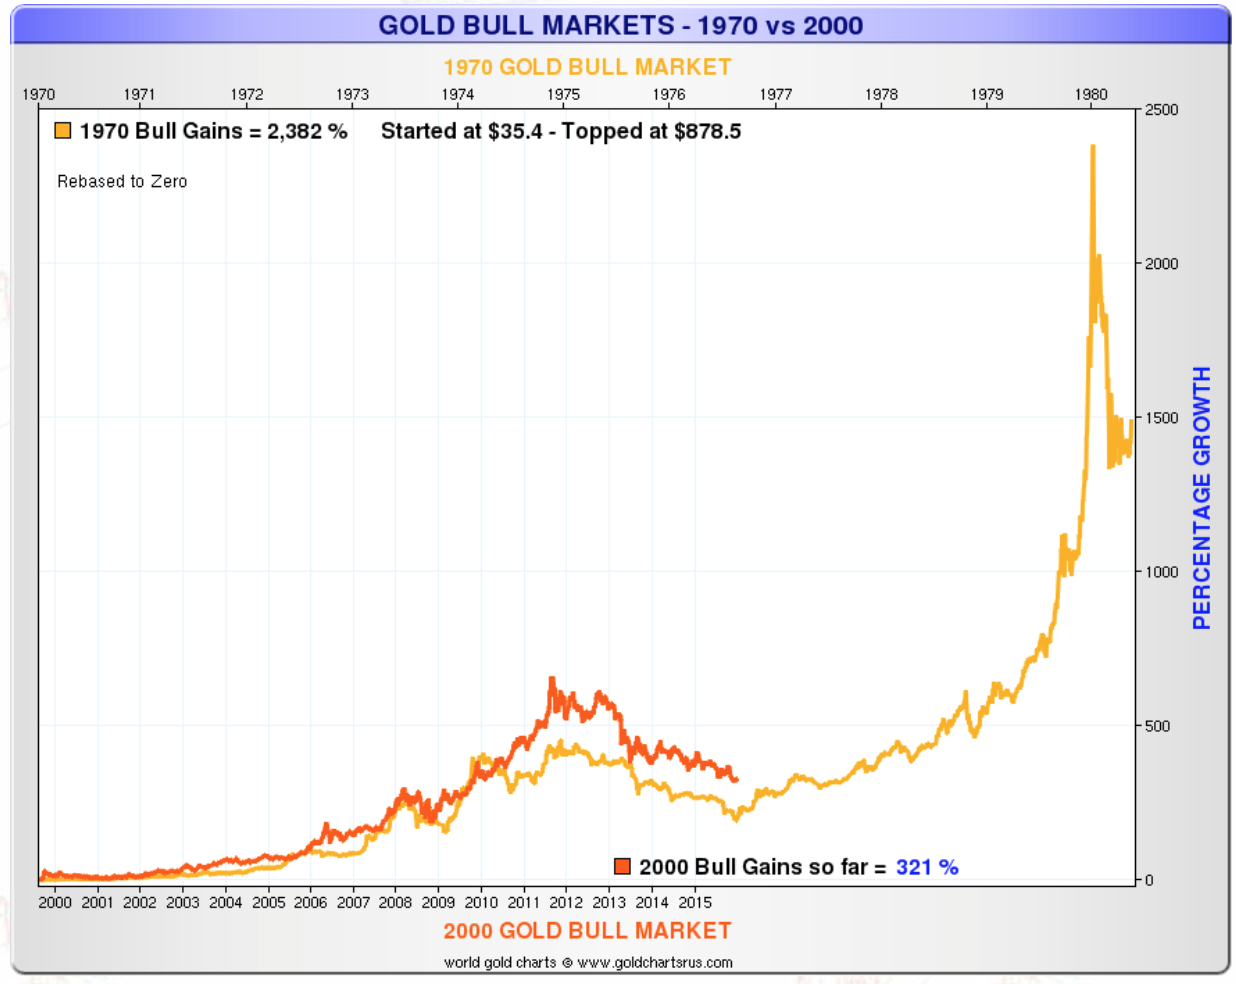
I didn’t go through the gold mania in the ‘70s but I can definitely tell you the $1,900 was not the top of a bubble by any means. Just compare the gold price acceleration (Price Rate of Change) in the ‘70s with the recent one.
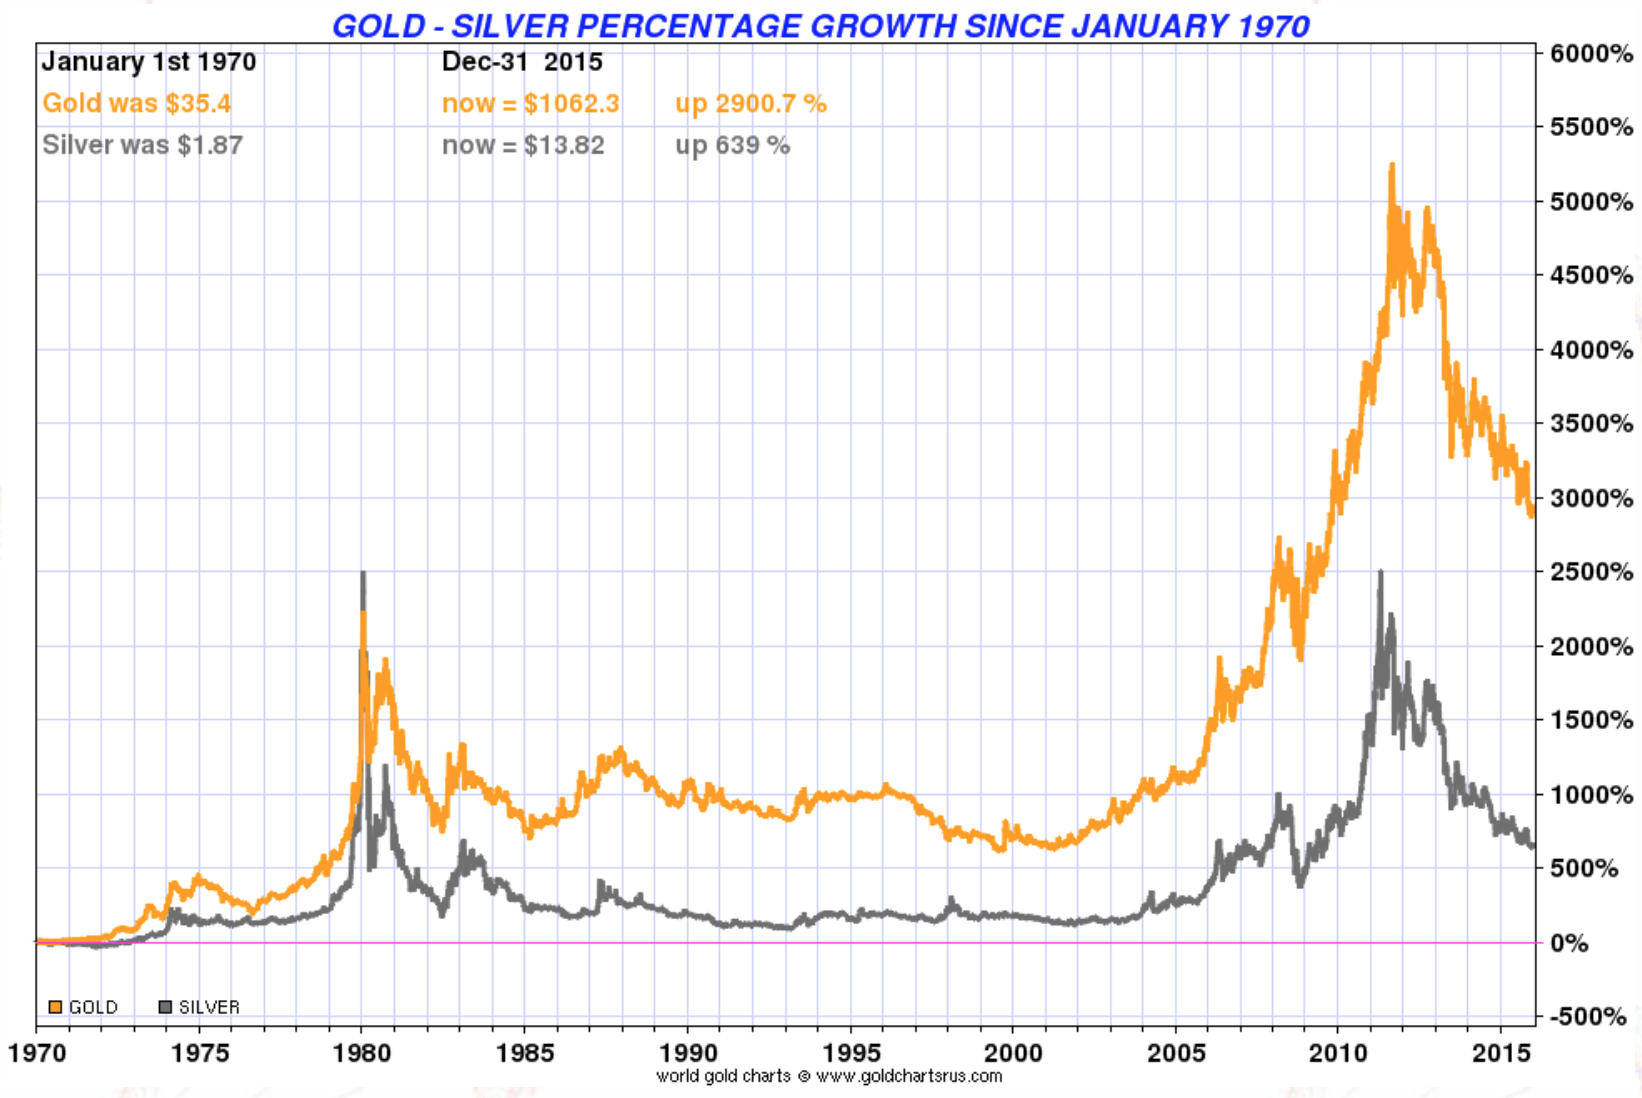
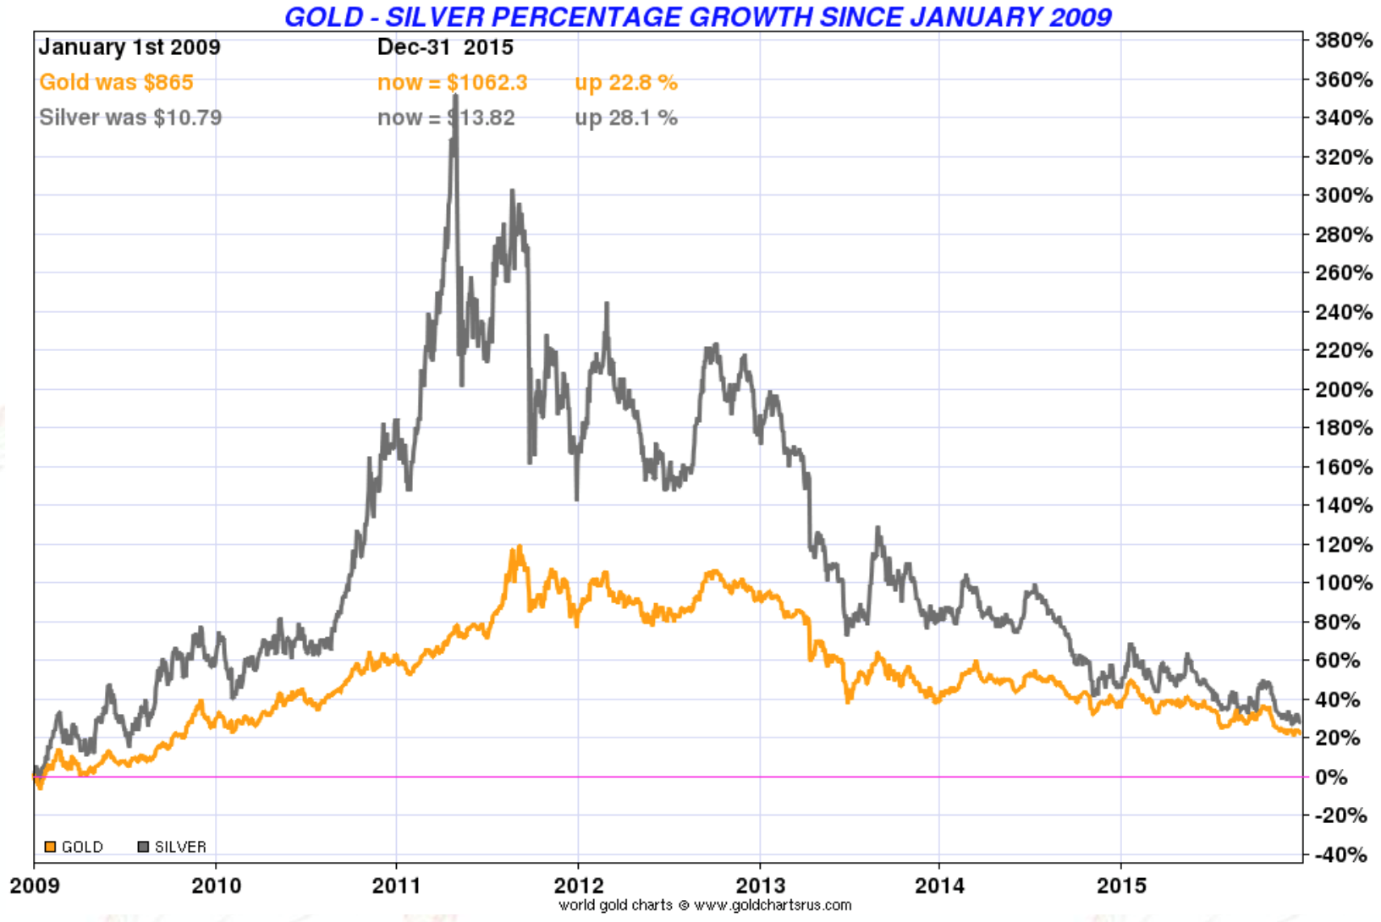
All the charts above could easily be visualized applying to silver as well. Since the financial crisis in 2008, both gold and silver have been acting like hard currencies with silver following gold as the “poor man’s gold”, but with more volatility. The currency wars amplified in 2015 and I think they will end with a collapse of the present international monetary system and a reset. Until then gold and silver will be a good place to park your money. Gold and silver are hard cash and once the international monetary system is reset you will be able to exchange them in income producing assets or spend them, contrary to fiat currencies, which will be worthless.
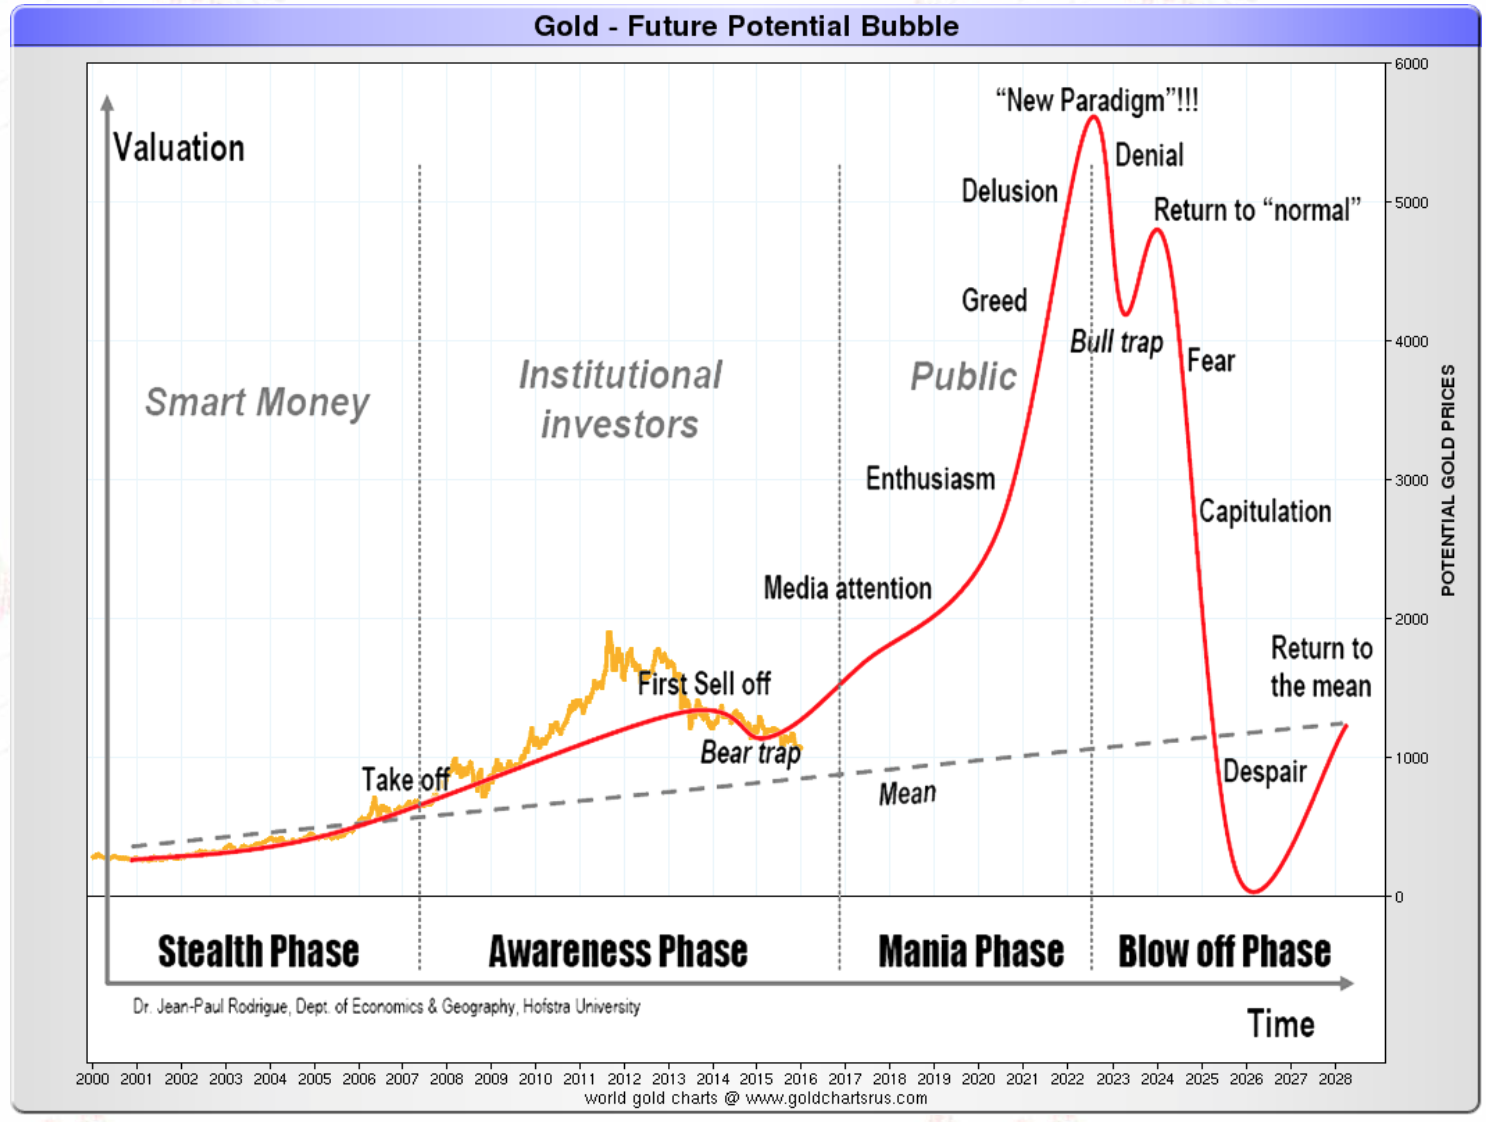
The chart below is the scenario I prefer both for gold and silver. If we have a repeat of the ‘70s it would mean an increase in gold price of approximately 2,000% from the present level of $1070. That could take gold even over $10,000. This scenario would happen in a hyperinflationary environment. In a deflationary environment the banking and financial system would collapse and hard cash would hold its exchange value, even at $500 gold.
The reason for me to buy gold, but also silver, in 2016 remains the same as last year, and that is as money in extremis. It even gets reinforced by the correction and an extreme oversold sentiment. [All that happened]…in 2015 has strengthened, not weakened my hypothesis of a collapse and reset of the international monetary system.
…Whatever the outcome of the reset I am sure gold will be part of the new international monetary system in some form.
- Both China and Russia have indicated they intend to use gold in pushing for a system reset. Their massive buying also supports their public statements.
- The European Union made comments on a regular basis in recent years in favour of gold.
- Recent gold buying by the Federal Reserve Bank of India from the IMF and initiatives to monetize India’s gold make the U.S. the only major opposition to gold coming back into the official international monetary system.
More Charts:
[The original article was written by Dan Popescu (GoldBroker.com) and is presented here by the editorial ... more


