
Gold: Time For A Breather Is At Hand
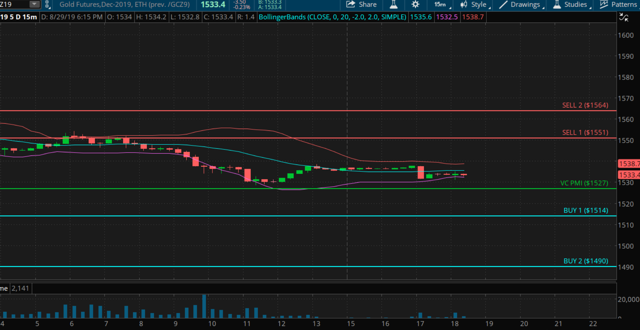
As we look at the December gold contract with the weekly Variable Changing Price Momentum Indicator (VC PMI) indicators, it is clear on the chart that the Sell 2 (S2) level is $1,564. The market made a high of $1,565 on the 25th of August at 3:15 pm (Pacific Time). Since then, the market has reverted back down below the Sell 1 (S1) level of $1,551. It has traded around that level until we saw the market break down decisively on the 29th of August at about 6:30 am, activating a trigger point on a close below $1,551.
"The VC PMI artificial intelligence identifies the S1 and S2 levels as levels of supply," Equity Management Academy CEO Patrick MontesDeOca said.
"If the market tests these levels and then closes below these levels, it confirms a short trigger from the extreme levels above the mean."
As we look at this signal at 10:26 am on August 29, the market short-signal here at $1,548.70 has a stop at $1,551, using the 15-minute bar. We teach our Equity Management Academy subscribers not to use straight stops but to use the 15-minute bar on the close to liquidate positions. As we follow the signal being short from this level, which was activated from S1 at $1,551, the target automatically is the level below, the mean, of $1,527.
You can see on the chart the market reaction against the price of $1,551, which gave you several opportunities to activate this short signal. The artificial intelligence identifies the trigger point based on the 15-minute bar, activating the target below of $1,527.
Silver is currently trading at $1,536. If you shorted the market at around $1,549, you can begin to trail your stop as the market begins to activate the target below. Once the target is met, we wait for the market to activate the next signal. Stay neutral until then.
The VC PMI structure provides you with trigger points for the highest probability trades.
Review
The silver market has activated a short trigger point from the S1 and S2 levels of the extreme levels above the mean. The S2 level of $15.64 activated a 95% probability of the market reverting back to the mean of $15.27. The first target was $15.51, which was completed. The S1 level has activated a short trigger with a target of $15.27.
"We have activated short trigger points using the VC PMI from the S1 and S2 levels," MontesDeOca said, "where it is telling us there is going to be distribution of supply. The chart shows that we are starting to see more sellers overpowering the buying demand, which translates into the price coming down into the target zones."
The first target is $15.27. A second close below the average mean will activate a bearish trend momentum and will identify the next target below as $15.14. The Buy 2 (B2) level is $14.90. These are the extreme levels below the mean. If activated, Buy 1 (B1) has a 90% probability of the market reverting back to the mean, while B2 has a 95% probability of a reversion to the mean.
When you want to trade, turn to the VC PMI, and it will provide you with the information to trade intelligently.
The VC PMI Automated Algorithm
We use the proprietary Variable Changing Price Momentum Indicator (VC PMI) to analyze the precious metals markets and several indices. The primary driver of the VC PMI is the principle of reversion to the mean ("Mean Reversion Models of Financial Markets," "The Power of Mean Reversion in Factor- Based Investing"), which is combined with a range of analytical tools, including fundamental logic, wave counts, Fibonacci ratios, Gann principles, supply and demand levels, pivot points, moving averages, and momentum indicators. The science of Vedic mathematics is used to combine these elements into a comprehensive, accurate, and highly predictive trading system.
Mean reversion trading seeks to capitalize on extreme changes in the price of a particular security or commodity, based on the assumption that it will revert to its previous state. This theory can be applied to both buying and selling, as it allows a trader to profit on unexpected upswings and buy low when an abnormal low occurs. By identifying the average price (the mean) or price equilibrium based on yesterday's supply and demand factors, we can extrapolate the extreme above this average price and the extreme below it. When prices trade at these extreme levels, it's between 90% (sell 1 or buy 1 level) and 95% (sell 2 or buy 2 level) probable that prices will revert to the mean by the end of the trading session. I use this system to analyze the gold and silver markets.
Strengths And Weaknesses
The main strength of the VC PMI is the ability to identify a specific structure which price level traders can execute with a high degree of accuracy. The program is flexible enough to adjust to market volatility and alerts you when such changes take place, so one can adjust strategies accordingly. Such changes include when the market breaks out of a consolidation phase or a trend accelerates. Such volatility usually happens when the market has produced a signal at the S2 or B2 level, and the market closes above or below these extreme levels.
The day trading program then confirms that a higher fractal in price has been identified, and the market will move significantly higher, although the same principle applies if the market falls significantly. The price closing above the S2 level indicates that the buying demand is greater than the supply. This means that the market has found support for the next price fractal. Conversely, the price closing below the B2 level indicates that the selling pressure has met demand greater than supply at the extreme below the mean, and prices should revert back to the mean.
The basic concept of the VC PMI is that the program trades the extremes of supply and demand based on the average price daily, weekly, and monthly.
The strongest relationship we find in the algorithm is when the daily price is harmonically in alignment with the weekly and monthly indicators. We call this "harmonic timing." Such an indication produces the highest probability (90%) that the price will revert from these levels to its daily, weekly, or monthly average.
Disclosure: I am long DUST.
To learn more about how the VC PMI works and receive weekly reports on the E-mini, gold and silver, check us out on more


