

Image Source: Unsplash
- WTI Crude Oil rises on Monday, breaking a seven-day losing streak and rebounding from a two-month low.
- Market focus shifts to US-Russia peace talks on Ukraine scheduled for August 15 in Alaska.
- WTI faces immediate resistance at Friday’s high of $63.89, with further hurdles at the 100-day SMA ($64.48) and 50-day SMA ($66.42), while support lies at $62.36, $61.50, and $60.00.
West Texas Intermediate (WTI) Crude Oil attracts fresh buying interest on Monday, breaking a sharp seven-day losing streak that had dragged prices to their lowest level in two months. The rebound comes as traders shift their attention to the upcoming US-Russia peace talks on Ukraine, scheduled to take place in Alaska on August 15.
The mild recovery comes after a bruising week in which the US benchmark slid nearly 5% its steepest drop since late June, amid fears over slowing global demand, fresh tariff shocks, and rising OPEC+ output. At the time of writing, the Crude Oil is trading around $63.50, up over 1.0% at the start of the American trading session.
Adding to the backdrop, Washington’s latest sanctions drive has intensified pressure on major Russian oil buyers. The US recently imposed an additional 25% tariff on Indian goods over New Delhi’s purchases of discounted Russian Oil, while similar measures against China are reportedly under consideration.
Any diplomatic breakthrough in the Alaska talks could ease geopolitical risk premiums and open the door to a recalibration of global Oil flows, particularly if it results in a phased rollback of sanctions on Russian exports. Conversely, if negotiations fail to produce tangible outcomes, markets may brace for renewed volatility as traders hedge against the risk of further supply disruptions and heightened geopolitical tensions.
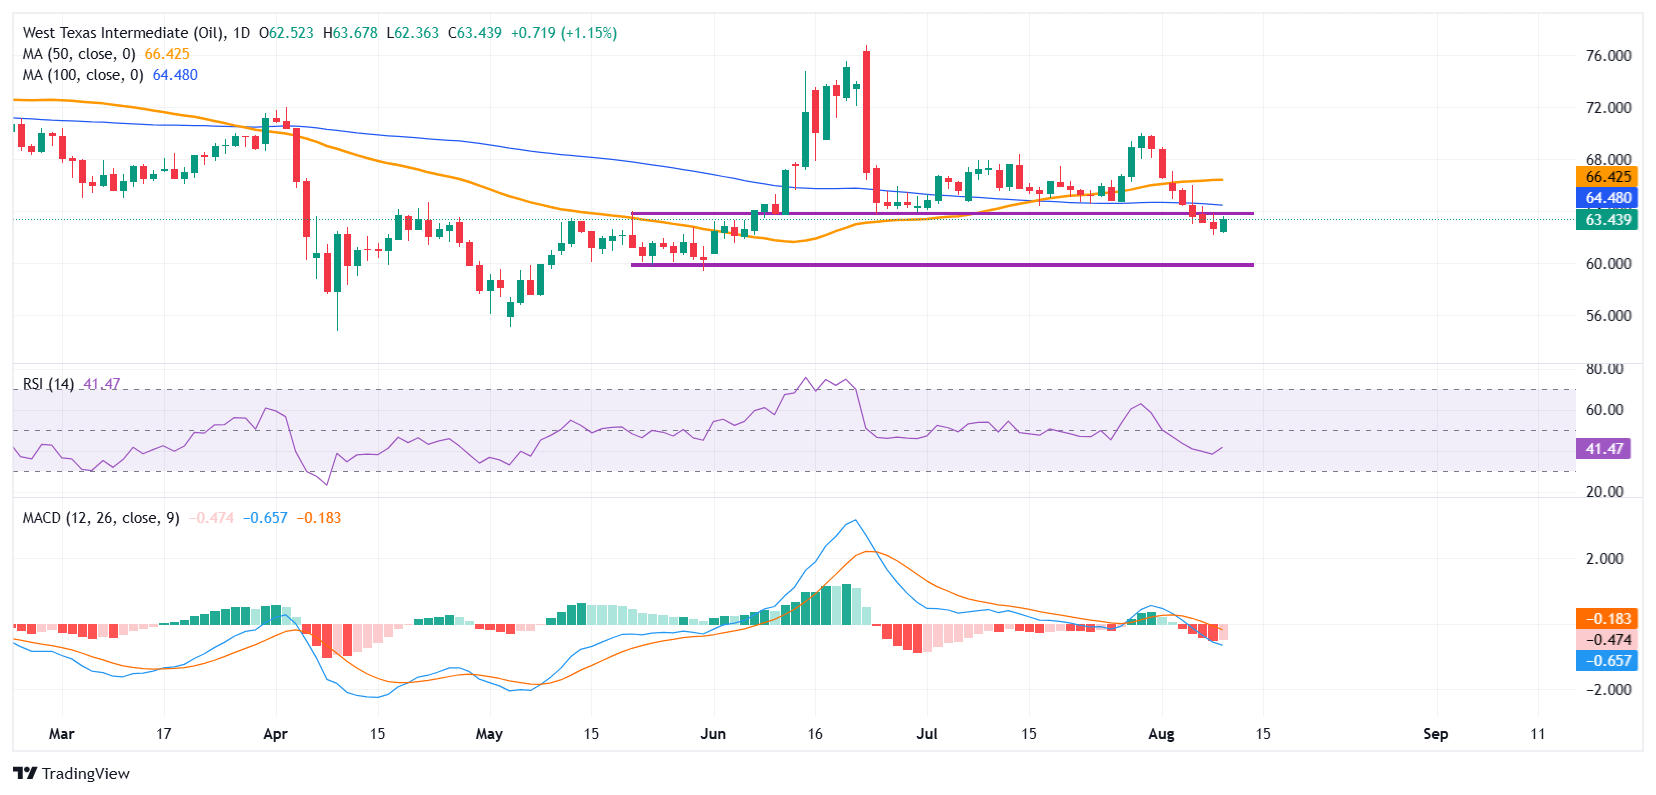
From a technical perspective, WTI is attempting to recover from last week’s heavy losses but faces immediate resistance at Friday’s high of $63.89, a level that overlaps with a key support-turned-resistance zone and serves as a pivotal hurdle for bulls. If cleared, the next obstacles are the 100-day Simple Moving Average (SMA) at $64.48 and the 50-day SMA at $66.42.
On the downside, initial support is seen at the intraday low of $62.36, with short-term support at $61.50. A break below this level could expose the $60.00 handle, which stands as a strong psychological and structural support.
The Relative Strength Index (RSI) on the daily chart is at 42, recovering modestly after sliding toward the lower end of the neutral range, suggesting that while bearish momentum has eased, any rebound could still face headwinds unless buying pressure strengthens. The Moving Average Convergence Divergence (MACD) indicator remains in negative territory, with the signal line above the MACD line and histogram bars still slightly red, indicating that downward momentum persists. However, the recent flattening of the histogram suggests selling pressure may be stabilizing, hinting at a potential shift if follow-through buying emerges.
More By This Author:
EUR/GBP Price Forecast: Potential Double Top At 0.8740-0.8750
AUD/USD Extends Rally As Fed Rate Cut Bets Grow, Focus Shifts To RBA
Gold Clings To Modest Weekly Gains, Remains Capped Below $3,400


Comments
Log in or sign up to join the conversation.