
World Market Weak Spots
Further to my post of February 9th, the following charts and graphs will illustrate which world markets have lagged over a longer one-year period and a shorter year-to-date period. They are presented without individual comment, as they visually illustrate that point.
However, I would conclude that, while there are a couple of particularly weak European countries (namely, Portugal and Greece), most world markets, overall, are in a one-year uptrend, under accumulation, and above their 20 and 50-day moving averages.
Failure of any of these to, at least, hold above their 50-day moving average could see the beginnings of a reversal of this bullish sentiment. Europe may hold the key in terms of precipitating a negative domino effect on other world markets. Watch for, either a stabilization of Portugal and Greece, or continued weakness in the near term. As well, Italy, Spain, France, India and China are worth watching for signs of any eroding confidence.
U.S. Major Indices
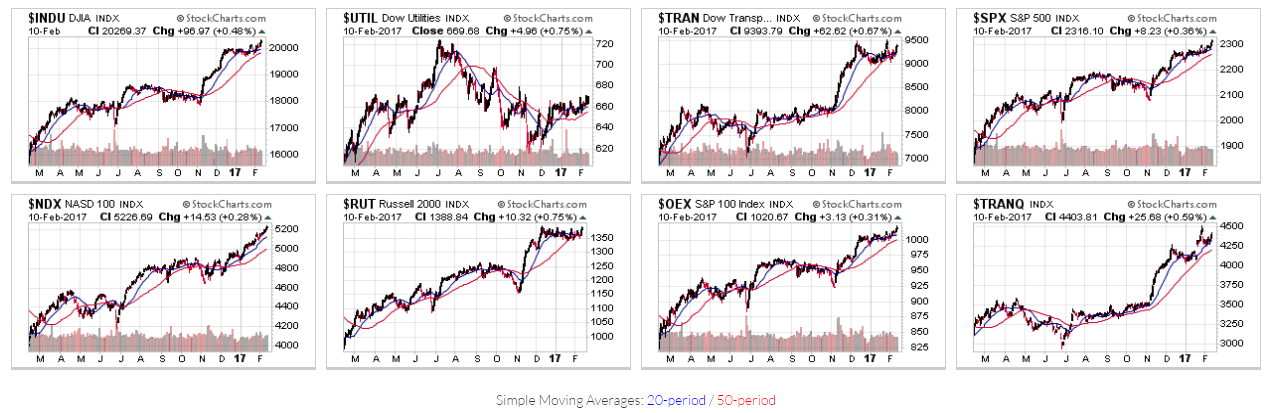
1-Year Daily charts
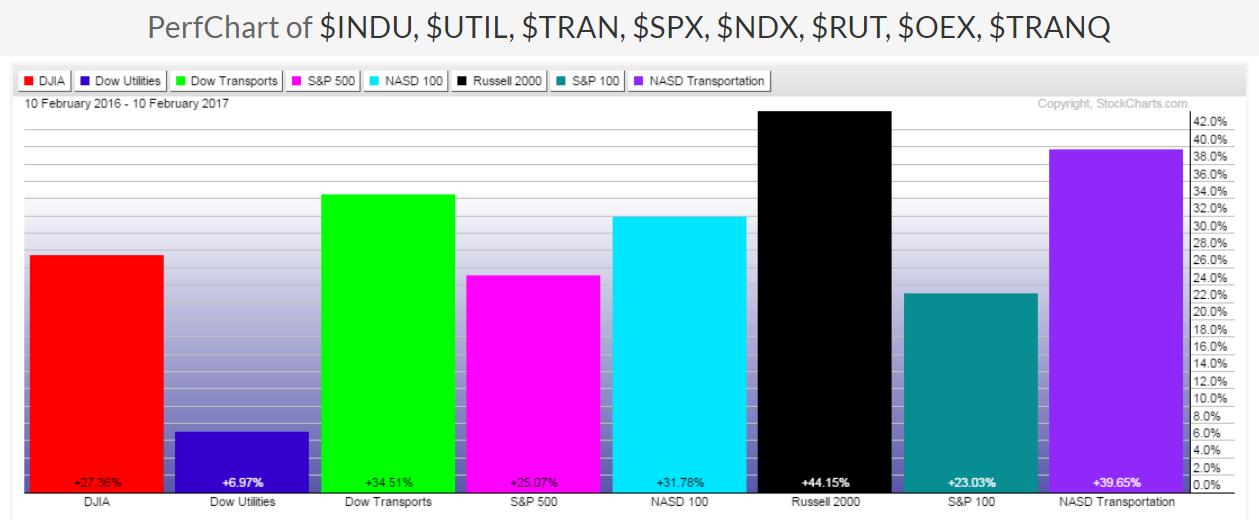
1-Year Percentage Gained/Lost Graph
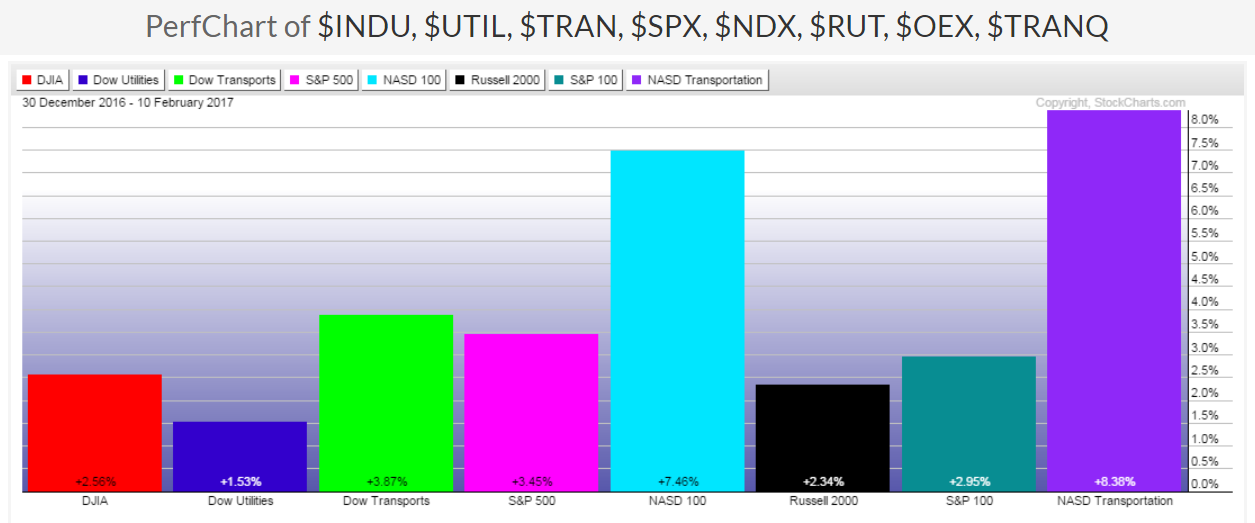
Year-to-Date Percentage Gained/Lost Graph
Major European Indices
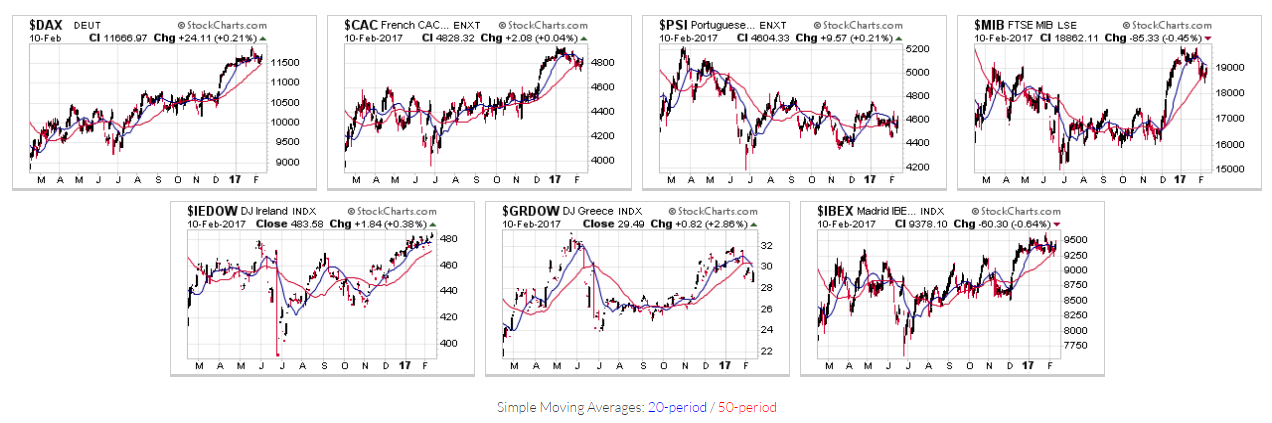
1-Year Daily charts
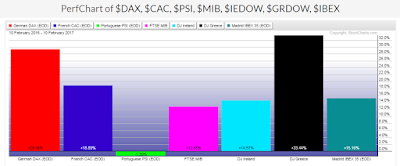
1-Year Percentage Gained/Lost Graph

Year-to-Date Percentage Gained/Lost Graph
Emerging Markets + BRIC ETFs, and Brazil, Russia, India & China Indices
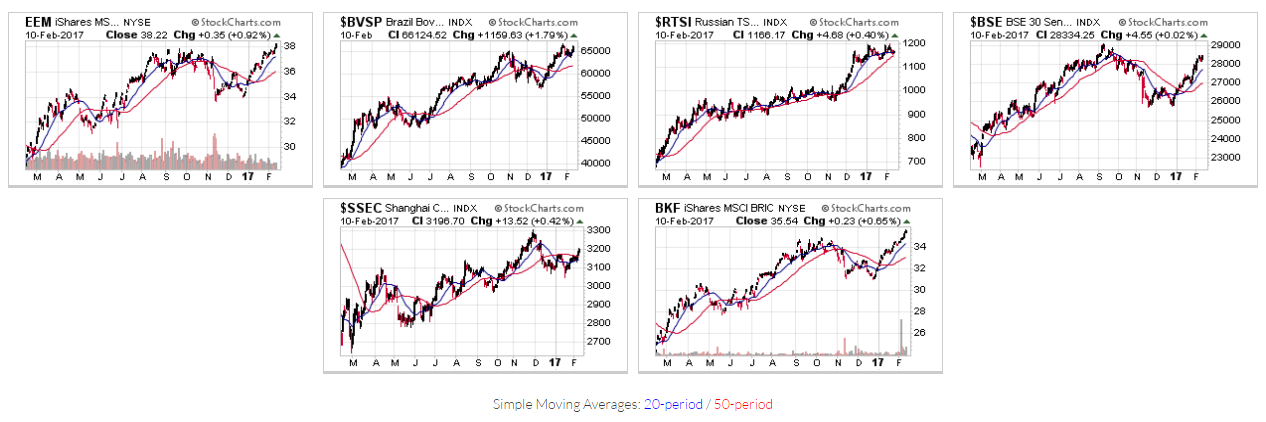
1-Year Daily charts

1-Year Percentage Gained/Lost Graph

Year-to-Date Percentage Gained/Lost Graph
Canada, Japan, UK, Australia & World Market Indices
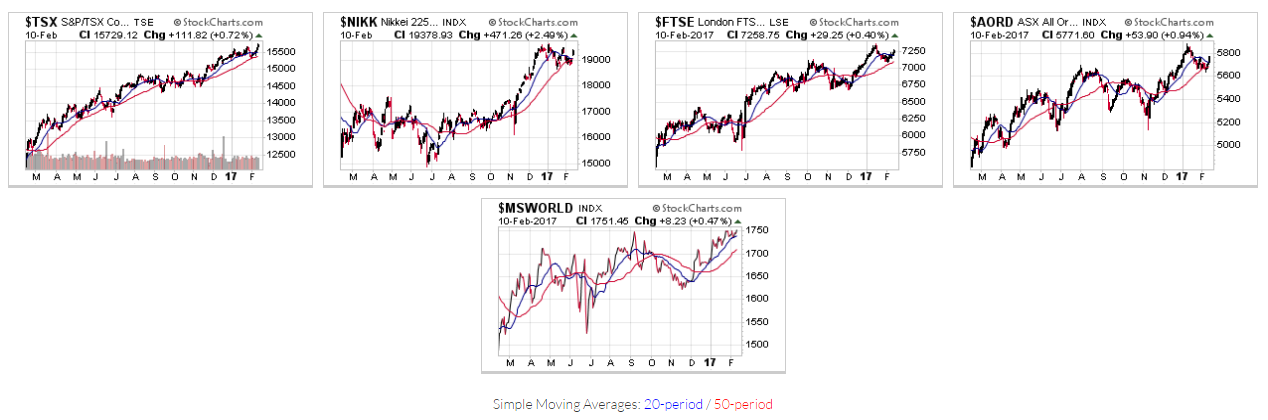
1-Year Daily charts
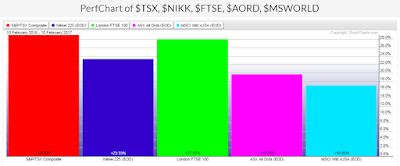
1-Year Percentage Gained/Lost Graph

Year-to-Date Percentage Gained/Lost Graph
Disclosure: None.


thanks for sharing