
Since October 19 the yield on 10-year treasuries has fallen 40 basis points, most of which happened in the last three days. What’s going on?
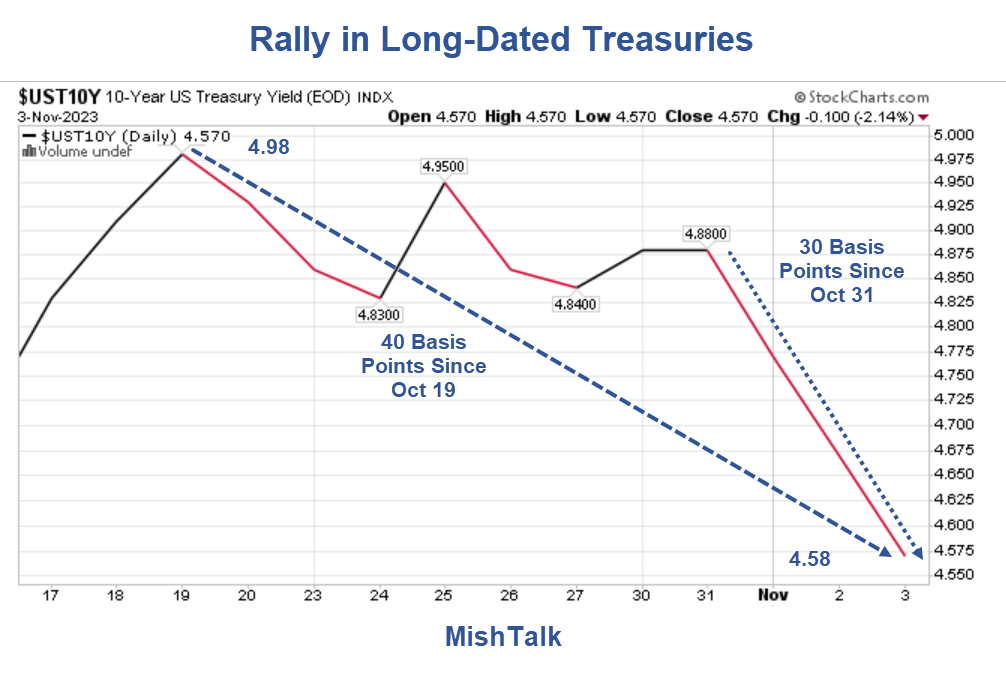
10-year US Treasury yield courtesy of StockCharts.Com, annotations by Mish
Four days ago the Wall Street Journal reported Bond Yields Slip After Treasury Announces Debt Auctions
- Auctions of 10-year notes will increase by $2 billion after being bumped up by $3 billion in the last adjustment in August.
- Thirty-year bond auctions are being increased by $1 billion, down from a $2 billion increase last time.
- Auctions of 20-year bonds are being left unchanged
The Journal posted a chart similar to the one I created above but theirs is only through Wednesday, November 1.
Today, the WSJ reports Markets Got an Unexpected Boost From Washington. Will It Mark a Turning Point?
The Treasury Department handed investors a happy surprise last week. Now the question is how far they can run with it.
Yields, which fall when bond prices rise, were also pulled lower by soft economic data and hints from the Federal Reserve that it likely won’t raise interest rates again this year. But it was the Treasury move that many saw as the crucial catalyst.
As it turned out, Treasury on Wednesday not only announced smaller-than-expected increases to longer-term debt auctions but also suggested that it was willing to overstep informal guideposts for how much in short-term Treasury bills to issue.
Just based on dollar amounts, the difference between what Wall Street had anticipated and what Treasury delivered was small. But investors embraced what they saw as the underlying message.
The Underlying Fundamentals
- A reduction of $1 billion in 10-year issuance is meaningless in any practical sense.
- The Congressional Budget Office (CBO) estimates a greater than $1T annual budget deficit for each of the next three years. I suggest it will be far greater.
- And the Fed is reducing its Treasury holdings by $60B per month on a scheduled Quantitative Tightening (QT) schedule.
The Medium-Term Daily Picture

10-year US Treasury yield courtesy of StockCharts.Com, annotations by Mish
On a daily chart, the rally in 10-year treasuries hardly seems significant. Yields were heavily extended and they have not yet fallen to the trendline no matter how you draw it.
Many suggested the huge rise in yields was due to China was dumping US treasuries but that is not the case.
Three-Point Simple Explanation
- US Treasury yields were very extended because economic data had been trending stronger than expected.
- More recent data was weaker than expected.
- The Fed stressed multiple times in its November 1 FOMC Q&A press conference that it has done significant tightening already. This was an indication it was on perpetual hold unless stronger data came in.
It’s possible there is some psychological change based on a $1 billion reduction, but the simple explanation better explains the picture.
Point number one explains the rise (with market participants front-running expected Fed actions in front of it). Points 2 and 3 above explain the rally.
ISM Manufacturing Plunges to 46.7 Percent. New Orders, Backlogs in Contraction

Image and excerpts by permission and courtesy of the Institute for Supply Management
The biggest portion of the rally started on November 1. On that date I commented ISM Manufacturing Plunges to 46.7 Percent. New Orders, Backlogs in Contraction
That chart alone is sufficient to explain the rally in bonds. And check out the ISM panelist comments.
None of the top six manufacturing industries reported price increases in October. Eighty-nine percent of panelists’ companies reported ‘same’ or ‘lower’ prices in October, compared to 87 percent in September,” says Timothy R. Fiore, CPSM, C.P.M., Chair of the Institute for Supply Management® (ISM®).
A Prices Index above 52.9 percent, over time, is generally consistent with an increase in the Bureau of Labor Statistics (BLS) Producer Price Index for Intermediate Materials.
That comment by Fiore was by itself enough to trigger a huge bond rally. Then the Fed chimed in.
Some thought Fed Chair Jerome Powell was hawkish. Not me.
A Hawkish Interest Rate Hold by the Fed or Something Else?
Also on November 1, but following the ISM report, the Fed’s FOMC met to determine rates. The statement itself said nothing, but the press conference was another matter.
I asked A Hawkish Interest Rate Hold by the Fed or Something Else?
Hold Bias, Not a Tightening Bias
I watched the entire press conference and do not see a tightening bias.
I see a stated hold bias.
We have a jobs report on Friday and there will another one before the next meeting.
I think hikes are done.
The Market Thinks the Fed Is Done Hiking Interest Rates, So Do I

Mish analysis of CME Fedwatch futures positioning data.
On Thursday, November 2, I made my “I think hikes are done” conclusion above into a post: The Market Thinks the Fed Is Done Hiking Interest Rates, So Do I
The market reaction to yesterday’s FOMC meeting was decidedly dovish. The notion the Fed will get in another rate hike just went out the window.
My observations and conclusions were before the hugely underperforming jobs report on Friday. This brings us to …
Job Growth Slows to 150,000 Employment Drops by 348,000

On Friday, November 2, I reported Job Growth Slows to 150,000 Employment Drops by 348,000
Not only were payrolls much weaker than expected, but government jobs accounted for a third of them.
Nonfarm Payrolls and Employment Levels

Employment levels and jobs data from the BLS, chart by Mish.
Full time employment has barely risen all year (green highlights).
Those charts fully explain the rally in bonds. Add to those charts a mass of hedge funds and speculators betting on more hikes and having to unwind those trades.
So, you can believe the WSJ explanation, any number of Fed manipulation theories, or you can believe mine.
Debunking the China Dumping Theory
Until the past week there was a relentless selloff in US treasuries that sent bond yields soaring.
Rumors and articles surfaced that China dumping Treasuries was the reason.
I discussed the situation on October 4 in Bond Bulls are Getting Crushed in a Relentless Selloff, It’s Not China
Has China sold any US treasuries? Likely not. Much of what China holds is hidden in State Owned Enterprises and custodied Treasuries.
How Sustainable is the Rally?
There are two competing forces, a weakening economy and massive debt issuance. Either one can win, but for now I think the top in yields is in.
In addition, factor in the possibility the Fed has already tightened too much. If so, they will be very hesitant to cut rates out of fear of stoking more inflation.
If you subscribe to this theory, 10-year treasuries are attractive for a trade.
Under What Conditions Would China Dump US Treasuries?
And finally, to understand the conditions under which China might dump treasuries, please see Under What Conditions Would China Dump US Treasuries or Dollar Holdings?
Amusingly, the conditions are nearly the opposite of what most dollar bears think!
More By This Author:
Under What Conditions Would China Dump US Treasuries Or Dollar Holdings?
Missing Crypto Fraud In Plain Sight
Job Growth Slows To 150,000 Employment Drops By 348,000


Comments
Log in or sign up to join the conversation.