
What's Behind The Dramatic Difference Between The Fed And The PBOC's Balance Sheets
The COVID-19 pandemic has caused an unprecedented monetary and fiscal expansion, globally. As BofA Chief Investment Strategist Michael Hartnett put it, "The monetary and the fiscal stimulus in terms of the announcements thus far, it comes to $20 trillion, $8 trillion of monetary stimulus, and $12 trillion of fiscal stimulus. And that number is a little over 20% of global GDP. So it's just astonishing and breathtaking and you have to sort of pinch yourself sometimes to sort of realize that it's actually happening."
Yet the expansion has been anything but uniform: while the Federal Reserve balance sheet expanded by nearly $3 trillion from March to May (14% of GDP), the balance sheet of China's PBOC actually contracted by almost RMB 1 trillion from January to June. At the same time, a PBOC official stated in a recent press conference that monetary policy support in H1 was equivalent to RMB 9 trillion (9% of GDP).
This begs the question: why didn’t the PBOC balance sheet expand during the recent easing cycle? How have various easing measures by the PBOC impacted its balance sheet? And how much room does the PBOC have to grow its balance sheet? In a recent note addressing these questions and more, Goldman Sachs (GS) provided the answers in a Q&A format.
Why didn’t the PBOC balance sheet expand during the recent easing cycle?
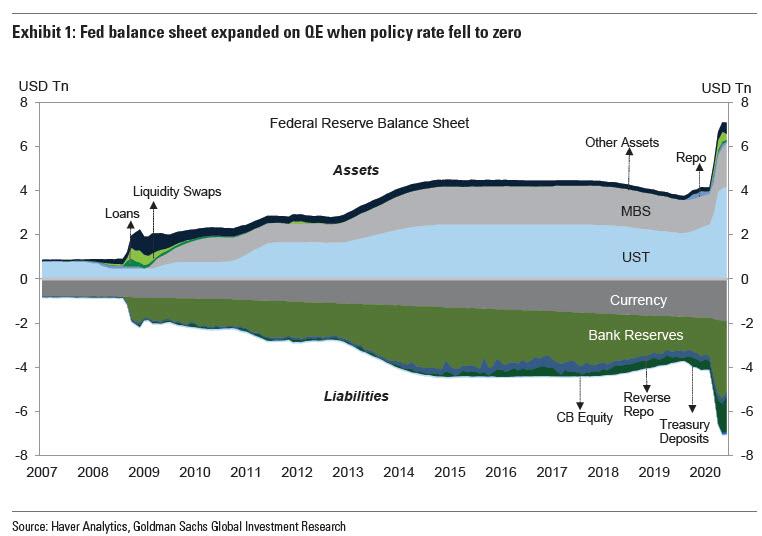
Investors are all too familiar with how the Fed’s action in response to COVID-19 outbreak has affected its balance sheet. With policy rate cut to zero, the Fed implemented "Unlimited QE" by adding Treasuries and MBS on the asset side of its balance sheet, financed by reserve creation on the liability side (Exhibit 1). The pattern was similar to QE1 in 2008 during the GFC, followed by QE2 in 2010 and QE3 in 2012.
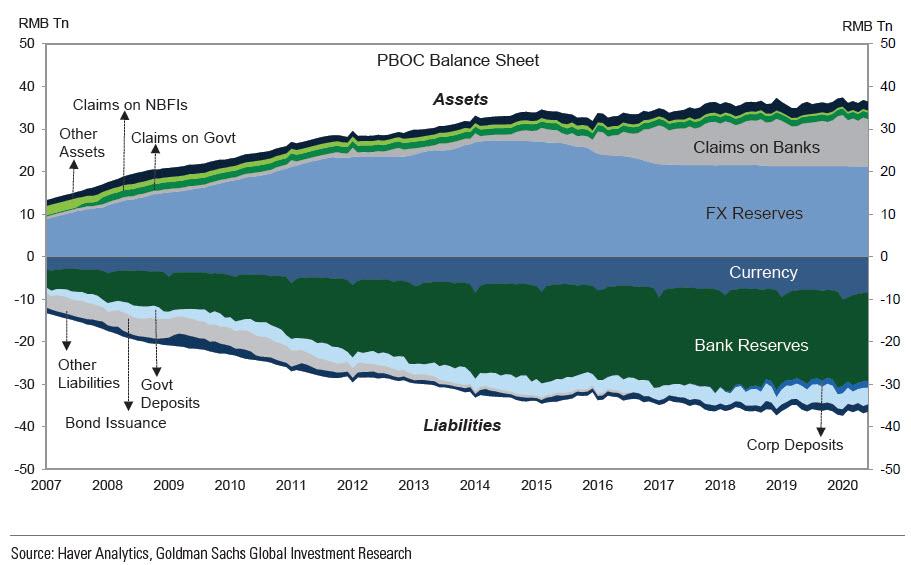
However, the easing mechanism is quite different for the PBOC. Unlike the US, China has been gradually transitioning from a quantity-based monetary policy framework to a price-based one. Quantity-based instruments such as RRR cuts still feature prominently in the central bank’s toolset. When the PBOC cuts RRR, the immediate effect is a reclassification of required reserve to excess reserve with no net impact on the central bank balance sheet.
After banks convert the excess reserve to loans and before the multiplying effect completes with part of loan proceeds flowing back as required reserves, the PBOC balance sheet may even shrink. The difference in how policies are conducted – QE purchases for the Fed and RRR cuts for the PBOC – is fundamentally the reason why we haven’t seen the PBOC balance sheet behave in the same way as the Fed balance sheet during the recent easing cycle.
What do the components of PBOC balance sheet tell us?
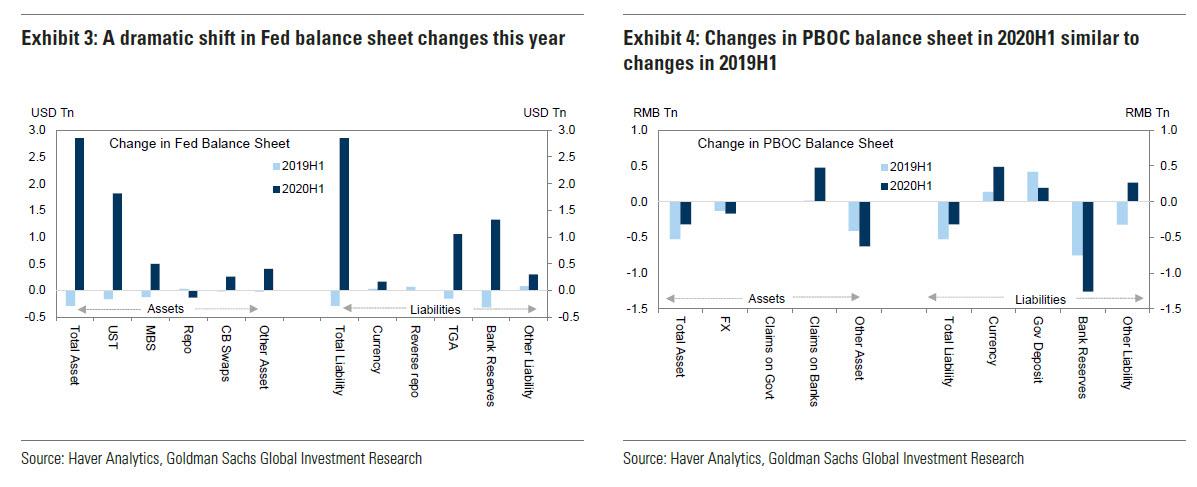
We next turn to the detailed breakdown of the Fed and PBOC balance sheets for further comparison. Because of seasonality in various asset and liability items, the components are first seasonally adjusted before looking at the change from December to June. Three observations are shown in Exhibits 3 and 4 and are highlighted below.
- First, while there was a dramatic reversal in Fed balance sheet changes from 2019H1 to 2020H1, this year’s changes in PBOC assets and liabilities have been similar to last year’s changes.
- Second, the net increase in the Fed balance sheet is large, whereas the net change in various components of the PBOC balance sheet is small.
- Third, the main driver of the expanding balance sheet for the Fed is the rise in both reserves (on the liability side) and central bank holdings of US Treasuries (on the asset side). For the PBOC balance sheet, however, the picture is more complicated: claims on banks increased modestly, mostly driven by relending/rediscount programs, and bank reserves fell by over RMB1 trillion - likely related to RRR cuts.
How much has the PBOC eased monetary policy this year?
Even before COVID-19, the diverse set of policy instruments at the PBOC’s disposal made it challenging to tally the total amount of easing implemented by the central bank. After the virus outbreak, additional tools have been used to support the economy.
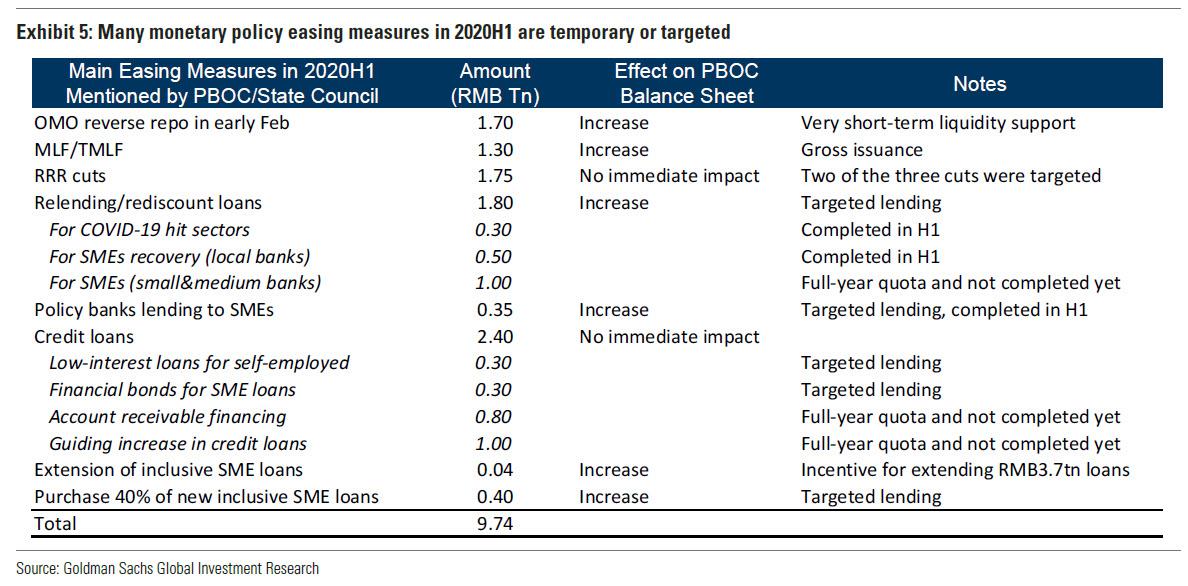
In their communications, PBOC officials commented on the many ways the central bank has supported the real economy and stated that non-interest rate monetary policy easing added up to RMB 9 trillion in 2020 H1. This is shown in Exhibit 5.
Three characteristics of the types of monetary policy easing carried out in 2020 H1 are noteworthy. First, some of the policy instruments are liquidity provisions for the very short term (e.g., the RMB 1.7 trillion OMO operations in early February were seven-day and 14-day reverse repos). Second, some of the cited numbers refer to gross rather than net lending. For example, MLF/TMLF outstanding actually declined during the first six months of this year despite the RMB 1.3 trillion operations.
Third, many of the easing measures are targeted in nature. They are earmarked for sectors hard-hit by the virus outbreak, small businesses and the self-employed who face the most challenge in accessing credit, and the time period when COVID-19 disruption to the economy is the most severe. For these reasons, the combined effect of these easing measures on the PBOC balance sheet have not been very large and may not last for a long time.
Why hasn’t China’s M2 increased as much as in the US?
A question we have repeatedly touched upon in the past three months is the difference in broad money aggregate expansion between the US and China. Indeed, M2 growth in the US jumped significantly upon Fed easing policies: from 6.7% yoy in December 2019 to 22.9% yoy in June 2020, something which prompted such stalwart deflationists as Russell Napier and Albert Edwards to expect an inflationary burst in the not too distant future.
By contrast, the increase in China’s M2 growth has been far more muted: from 8.7% yoy in December 2019 to 11.1% in June 2020. There are two reasons behind the divergence.
The first reason is simply because - as noted above - the amount of policy easing by the PBOC is less than the Fed. When taking into consideration the gross vs. net and short-term vs. long-term nature of the easing measures, the amount is even smaller than implied by the RMB 9 trillion headline cited by PBOC officials.
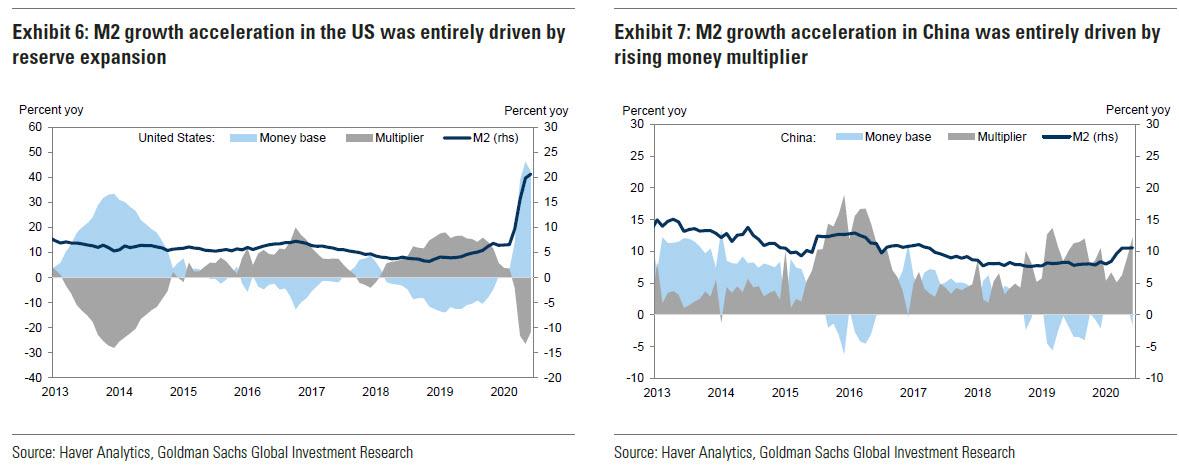
The second reason is related to how monetary policies are conducted in China vs. the US. In Exhibits 6 and 7, Goldman decomposes the drivers of M2 growth into money base and money multiplier. In the US, money multiplier fell this year on the COVID-19 outbreak and the economic downturn. M2 growth acceleration was entirely driven by the sharp expansion of money base.
By contrast, money multiplier rose in China and money base was little changed. Put differently, to promote lending and combat the worst recession since the Great Depression, the Fed had to aggressively increase money base, whereas the PBOC could resort to more direct tools such as targeted easing and window guidance to raise bank lending.
This means M2 growth does not need to (or simply can't amid persistent fears of a burst in inflation) accelerate as much in China to provide support to the economy.
How much more room for PBOC to expand balance sheet and to cut RRR?
Policymakers in China have been emphasizing the need not to go "all in" in supporting the economy during the COVID-19 outbreak and to keep ammunition for future downturns. In this context, how much room does the PBOC have in balance sheet management and RRR cuts?
For the balance sheet, note that the PBOC balance sheet as a share of GDP peaked at 65% in 2009. In contrast, the Fed's balance sheet would still be less than 50% of GDP by the end of this year when it expands to $9 trillion, as most economists expect. At the present level of 37% of GDP, the PBOC balance sheet appears to have room to expand if one uses the previous peak of 65% as the limit. Potential constraints in the PBOC balance sheet management include inflation and asset price considerations, financial leverage concerns, and capital outflow pressure.
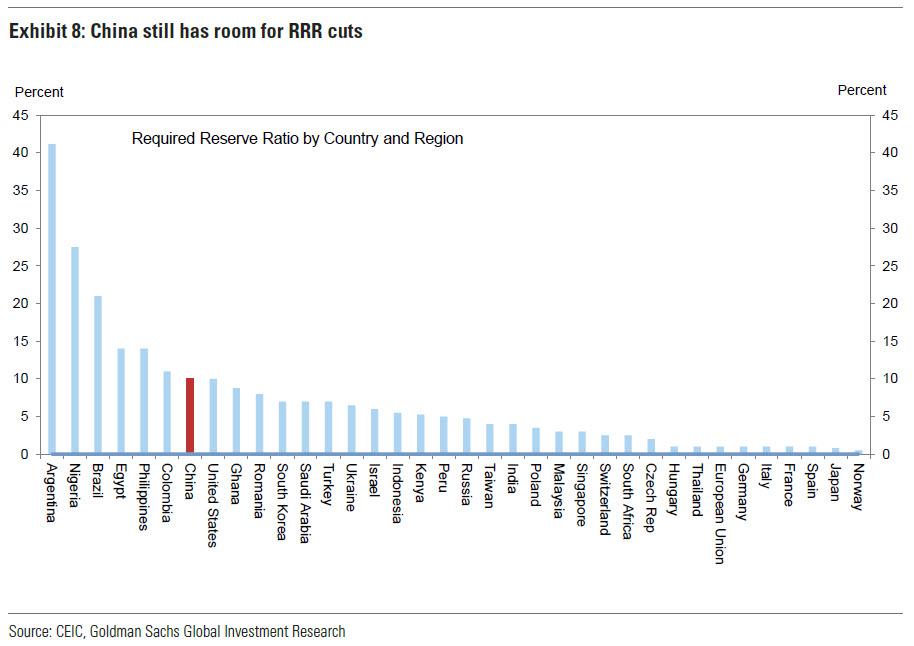
On RRR, Exhibit 8 shows RRR levels of different countries and regions at present. With the exception of a few EM countries where exchange rate considerations play a role, China’s RRR is still elevated relative to many other economies, suggesting room to cut if and when necessary. This also appears to be the view of some PBOC officials.
It is worth mentioning that the role of RRR in China’s monetary policy has been declining in recent years. While it played a central role in absorbing excess liquidity when trade surpluses led to sharply rising FX reserves before 2014, open market operations (OMO) and various lending facilities have become increasingly more important in the PBOC toolkit.
Of course, a multitude of factors matter in determining a country’s optimal size of the central bank balance sheet size and optimal level of RRR. The room to expand the balance sheet or cut RRR might be different from implied by a simple cross-country comparison. For example, financial stability is probably a more important constraint for the PBOC than for many other central banks.
In addition, having room to cut does not necessarily translate into actual cuts in the near future. Robust economic recovery thus far in China has lessened the pressure for policymakers to ease in recent months, and allowed them to continue the more targeted approach to monetary. As such, further notable easing moves by the PBOC may require clear signs of growth slowing more than expected going forward.
To summarize, if there is another dip in the global economy, while the Fed may be all in - as speculation swirls about the reserve status of the dollar - it will be up to China, as was the case in 2008/2009, to bail out the world again.
Disclaimer: Copyright ©2009-2020 ZeroHedge.com/ABC Media, LTD; All Rights Reserved. Zero Hedge is intended for Mature Audiences. Familiarize yourself with our legal and use policies every time ...
more

