
Our weekly Elliott Wave analysis reviews the GBP/USD monthly chart, the Bitcoin crypto currency daily chart, and the Gold weekly chart.

GBP/USD Bears Aiming at Double Bottom
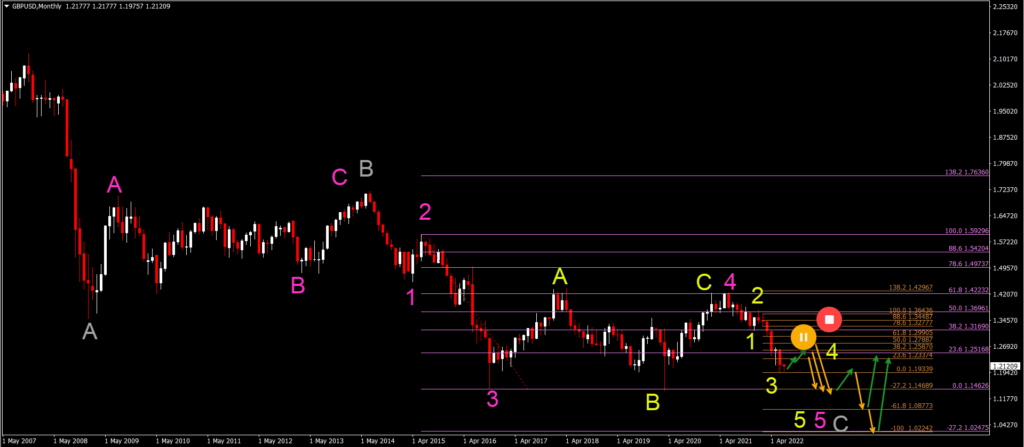
The GBP/USD downtrend is approaching the lows of the years 2016 and 2020. Let’s review if the Cable can break the double bottom for a new lower low:
- The GBP/USD seems to be moving lower in a bearish impulse, which is probably a wave 3 of some sort (marked as yellow).
- A bullish retracement is expected within a wave 4 (yellow) once the bearish wave 3 (yellow) has been completed.
- The Fibonacci retracement levels (brown) will act as a resistance zone. Especially the 23.6-50% Fibonacci levels.
- A break above the 50% Fib places the bearish analysis on hold whereas a deeper push up can even invalidate it.
- A bearish continuation (orange arrows) should take place after the wave 4 (yellow) is completed.
- The bearish wave 5 (yellow) should aim at the double bottom and could even go further down towards the FIbonacci targets.
- The downtrend could complete a wave 5 (pink) of wave C (gray), after which a bullish reversal could take place (green arrows).
Gold Bears Should See Reversal Soon
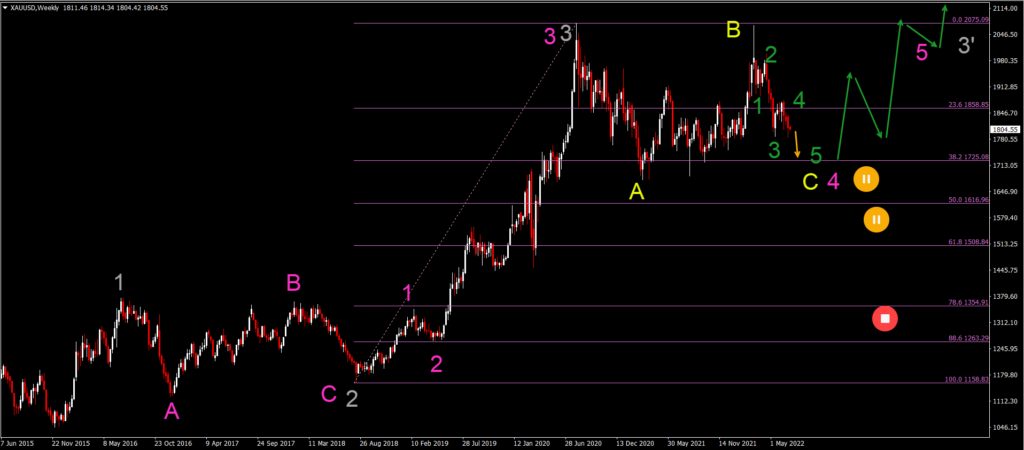
The Gold chart (XAU/USD) is showing a bearish correction at the moment. Let’s review how deep can the bears push it before finding support:
- The Gold weekly chart is seeing a bearish impulse develop within a wave 5 (green) of wave C (yellow) of wave 4 (pink).
- The bears are therefore not expected to keep control for all too long, even though a wave 4 can be choppy and lengthy.
- Eventually, price action should turn around at the support zones and Fibonacci levels for a bullish reversal.
- This bullish impulse could signal that the wave 4 (pink) is completed and that a wave 5 (pink) has started.
- This could be either part of a wave 5 (gray) or even still part of a wave 3’ (gray).
BTC/USD Bullish Reversal Expected within Wave B
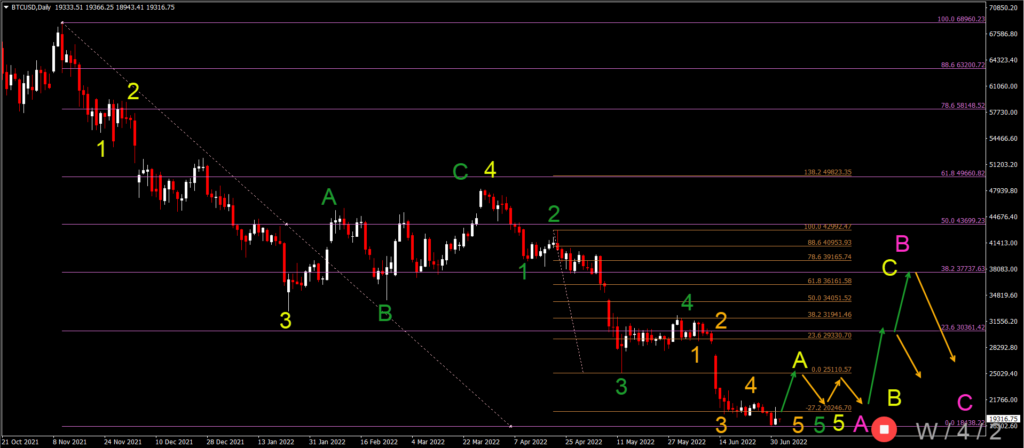
Bitcoin (BTC/USD) is showing a semi bullish daily candlestick pattern on Friday. Let’s review whether there is any reversal potential:
- The BTC/USD seems to have completed a 5 wave pattern (orange) with the most recent low.
- The bullish daily candlestick pattern could be a first signal that a bullish retracement is coming soon.
- The 5 wave (orange) could also complete a wave 5 (green) of wave 5 (yellow) of wave A (pink).
- An ABC (yellow) could emerge within a wave B (pink).
- The main targets for the wave B (pink) are at the 23.6% and 38.2% Fibonacci retracement levels.
- A deeper bullish retracement is not expected at the moment but this could change if price action starts to behave very bullishly.
- After completing a wave B (pink), a new bearish swing within wave C (pink) is expected to take price lower again and create a new low to complete an ABC zigzag (pink).
More By This Author:
Weekly Waves: EUR/USD, US30 And BitcoinEUR/USD Analysis & Overview June 2022
Weekly Waves: EUR/USD, USD/JPY And Bitcoin


Comments
Log in or sign up to join the conversation.