Weekly Forex Forecast - Sept. 20 - 24
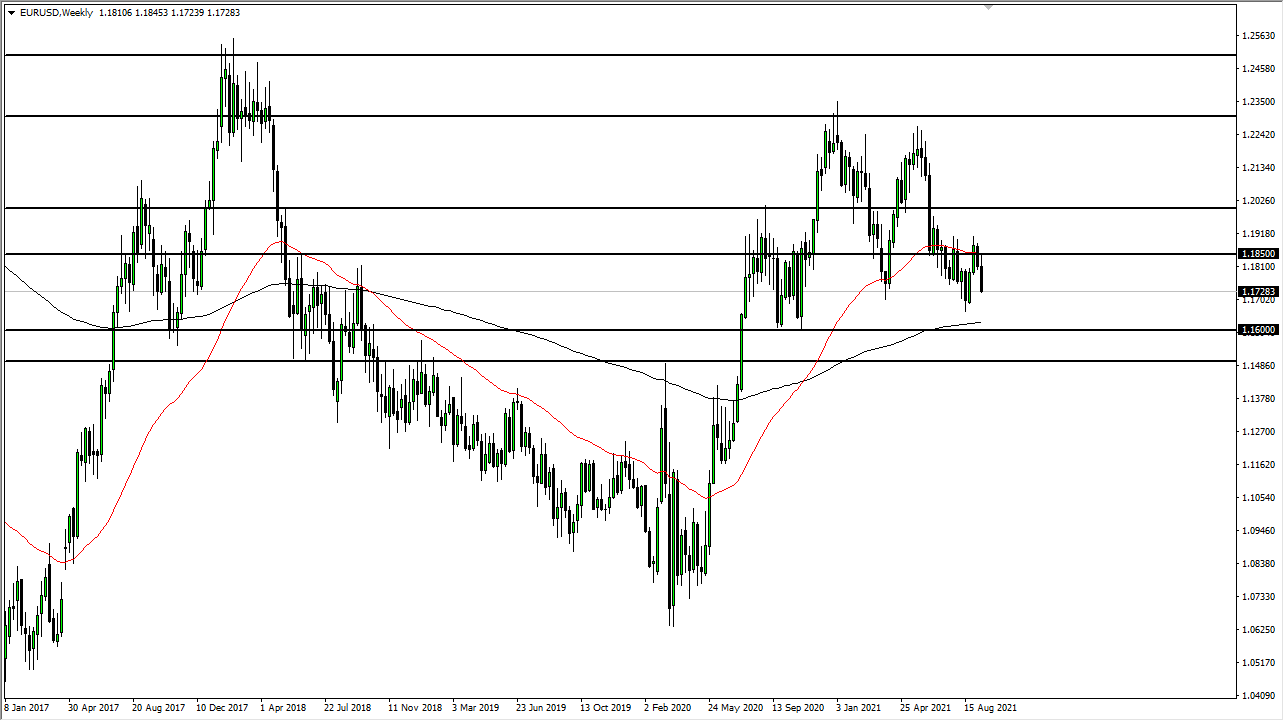
The euro initially tried to rally last week, reaching towards the 1.1850 level before falling apart. At this point, the market has crossed below the 1.18 level and the 1.1750 level after that. In general, this is a market that I think continues to see negativity as we have closed towards the bottom of the weekly candlestick. The market is likely to go looking towards the 1.16 level (FXE).
That is an area that has been massive support, so I think it has to be tested rather soon. In the short term, I think you should looking for signs of exhaustion on short-term charts to start selling.
GBP/JPY
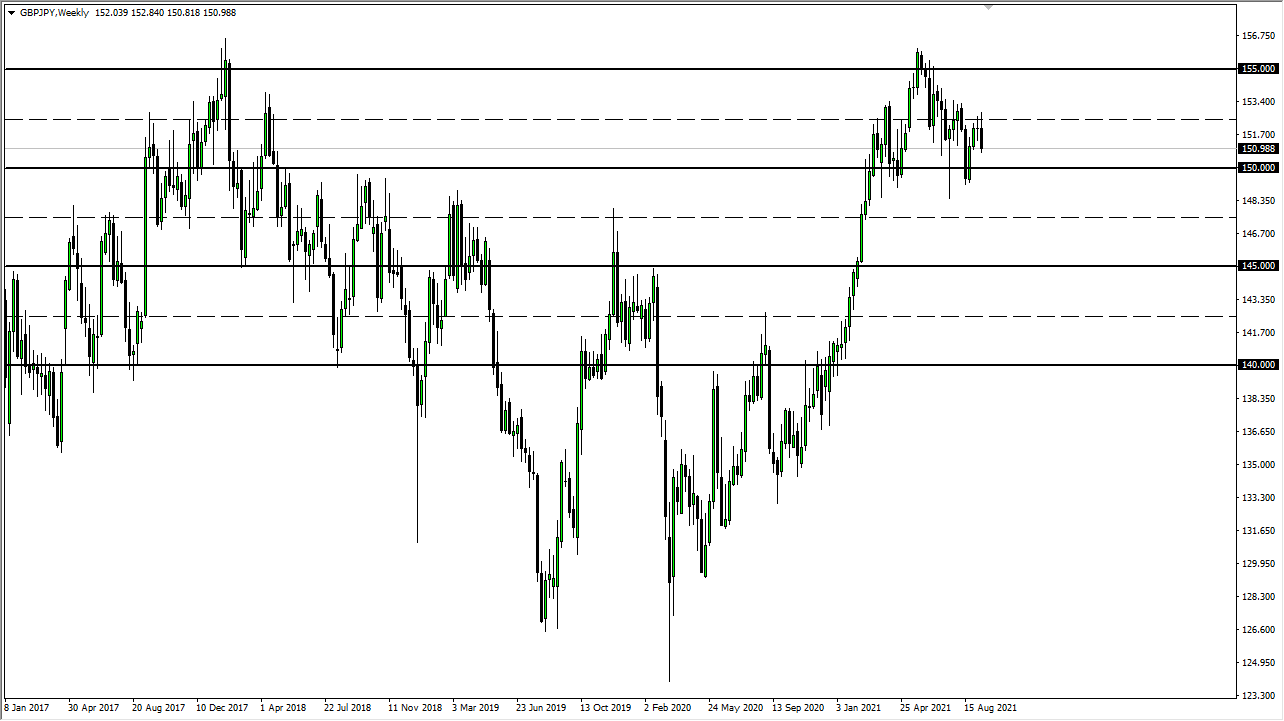
The British pound has rallied to kick off the week, only to turn around at the ¥153 level. The market has collapsed as we are starting to see a lot of negativity. The market is closing towards the bottom of the week, which does suggest that we are ready to go lower, perhaps reaching towards the ¥150 level. That is an area that I think kicks off a lot of support extending all the way down to the ¥149 level. If we were to break down below there, the market then would fall apart. In fact, you could even make an argument that we have formed a bit of a head and shoulders (FXB).
USD/ZAR
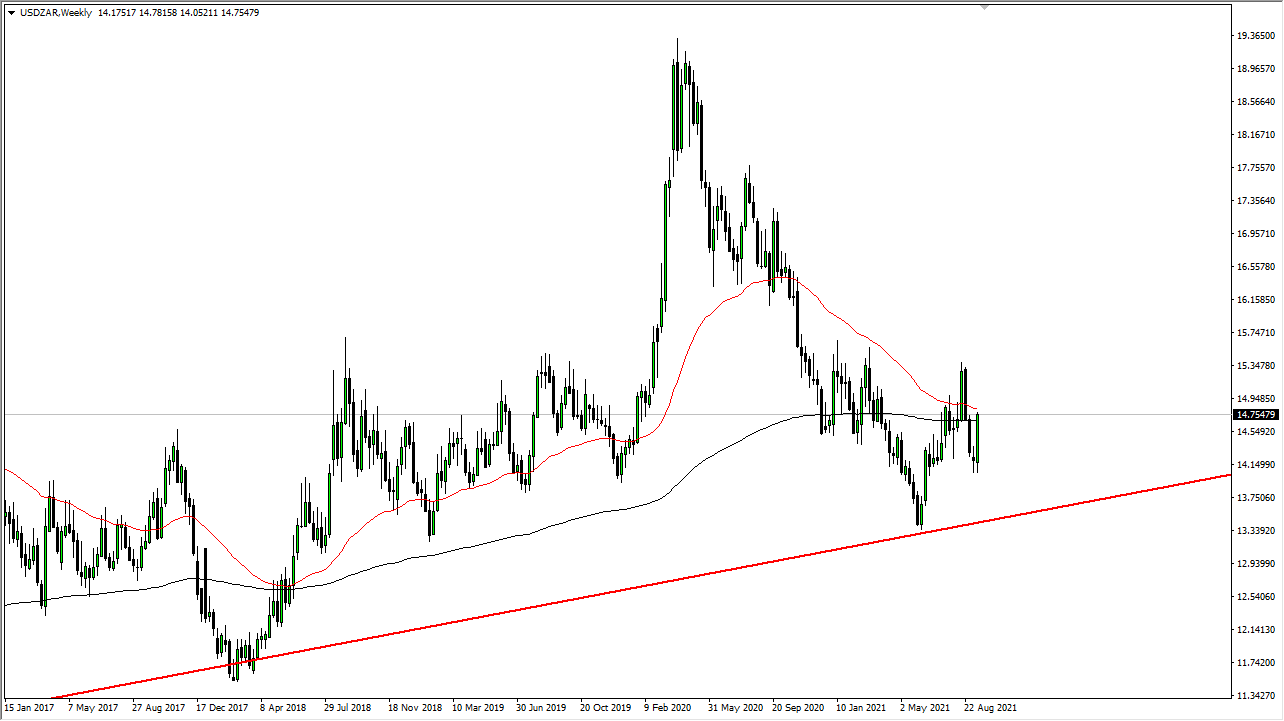
The US dollar rallied quite significantly last week, breaking above the 14.75 rand level. The 200-week EMA sits just below where we closed, at the very top of the candlestick. Ultimately, this is a market that I think will go looking towards the 15.50 rand level. After that, the market would go much higher as it would kick off a bit of an “inverted head and shoulders.” Keep in mind that the US dollar has been rallying against most currencies, so it makes a sense that the South African rand would get smoked if we break out above this region.
CAD/JPY
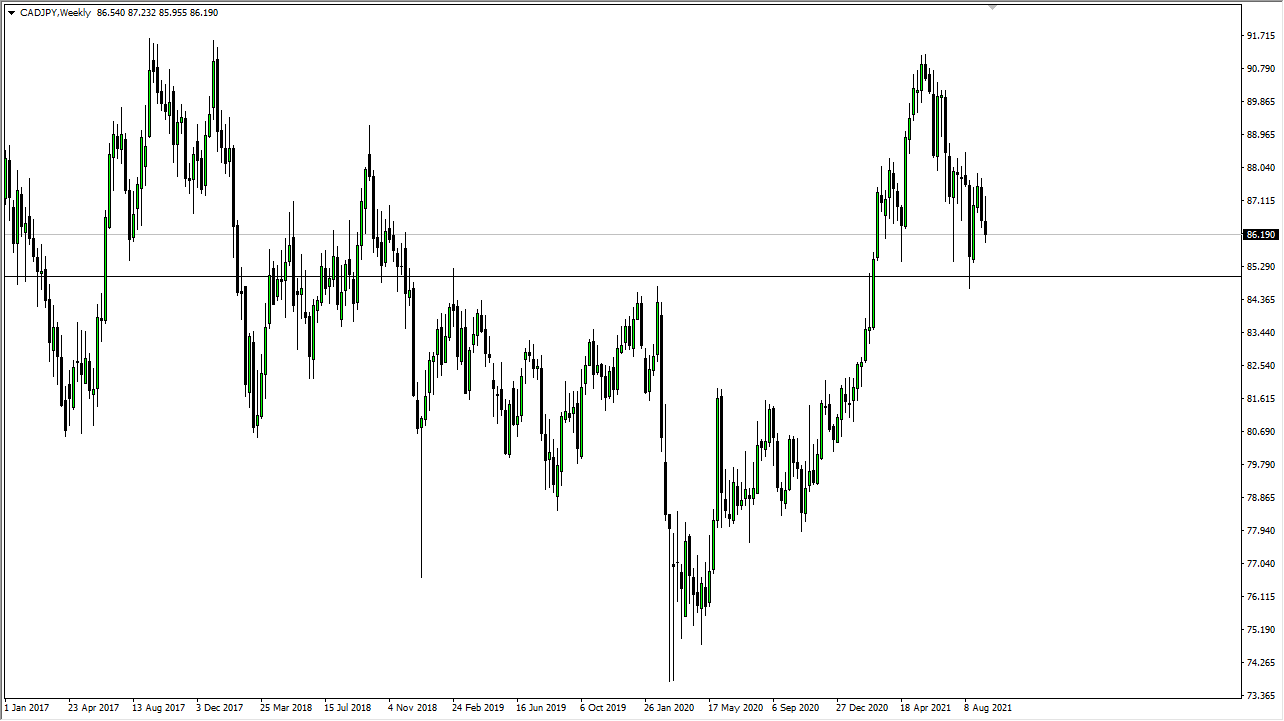
The Canadian dollar initially tried to rally against the Japanese yen but as you can see, we have fallen apart. The ¥85 level underneath is massive support, so if we can turn around and break down below there, the market is likely to go looking towards the ¥81 level. Rallies at this point will continue to struggle until we can get above the ¥88 level. It is worth noting that the Canadian dollar has been struggling even though the oil markets have been rather strong (FXC, OIL, fxy).
Disclosure: DailyForex will not be held liable for any loss or damage resulting from reliance on the information contained within this website including market news, analysis, trading signals ...
more


