

Yen. Image Source: Pixabay
The Japanese Yen (JPY) is weakening against the US Dollar (USD) on Thursday following news of a productive phone call between US President Donald Trump and Chinese President Xi Jinping. After an approximate 90-minute discussion between the leaders of the two largest economies in the world, Trump reported that he had a “very good phone call with President Xi”.
This de-escalation in geopolitical risk improved overall market sentiment and supported risk-on flows, leading to renewed USD appreciation against the safe-haven Yen.
At the time of writing, USD/JPY is trading above the 10-day Simple Moving Average (SMA), providing near-term support at 143.60.
Japan Coincident Index and US NFP take spotlight on Friday
For Japan, Friday’s focus turns to the release of the Preliminary Coincident Index and Leading Economic Index figures for April, scheduled at 05:00 GMT. Market expectations are for the Leading Economic Index to print at 104.1, with investors closely monitoring the data for any signals regarding Japan’s current economic performance and future growth outlook.
A rise in Japan’s Leading Index may strengthen the Yen, while a fall could weaken it on concerns of slowing momentum.
Meanwhile, Friday’s US economic agenda includes the release of the highly anticipated Nonfarm Payrolls (NFP) report, which offers insight into the health of the US labour market. Analysts expect the report to show that 130,000 new jobs were added in May, a slowdown from the 177,000 jobs added in April, while the unemployment rate is forecast to remain steady at 4.2%.
This release is particularly important as it directly influences Federal Reserve (Fed) policy expectations, which remain a key driver of USD/JPY price action.
USD/JPY recovers above 143.00 with major resistance firming at 144.00
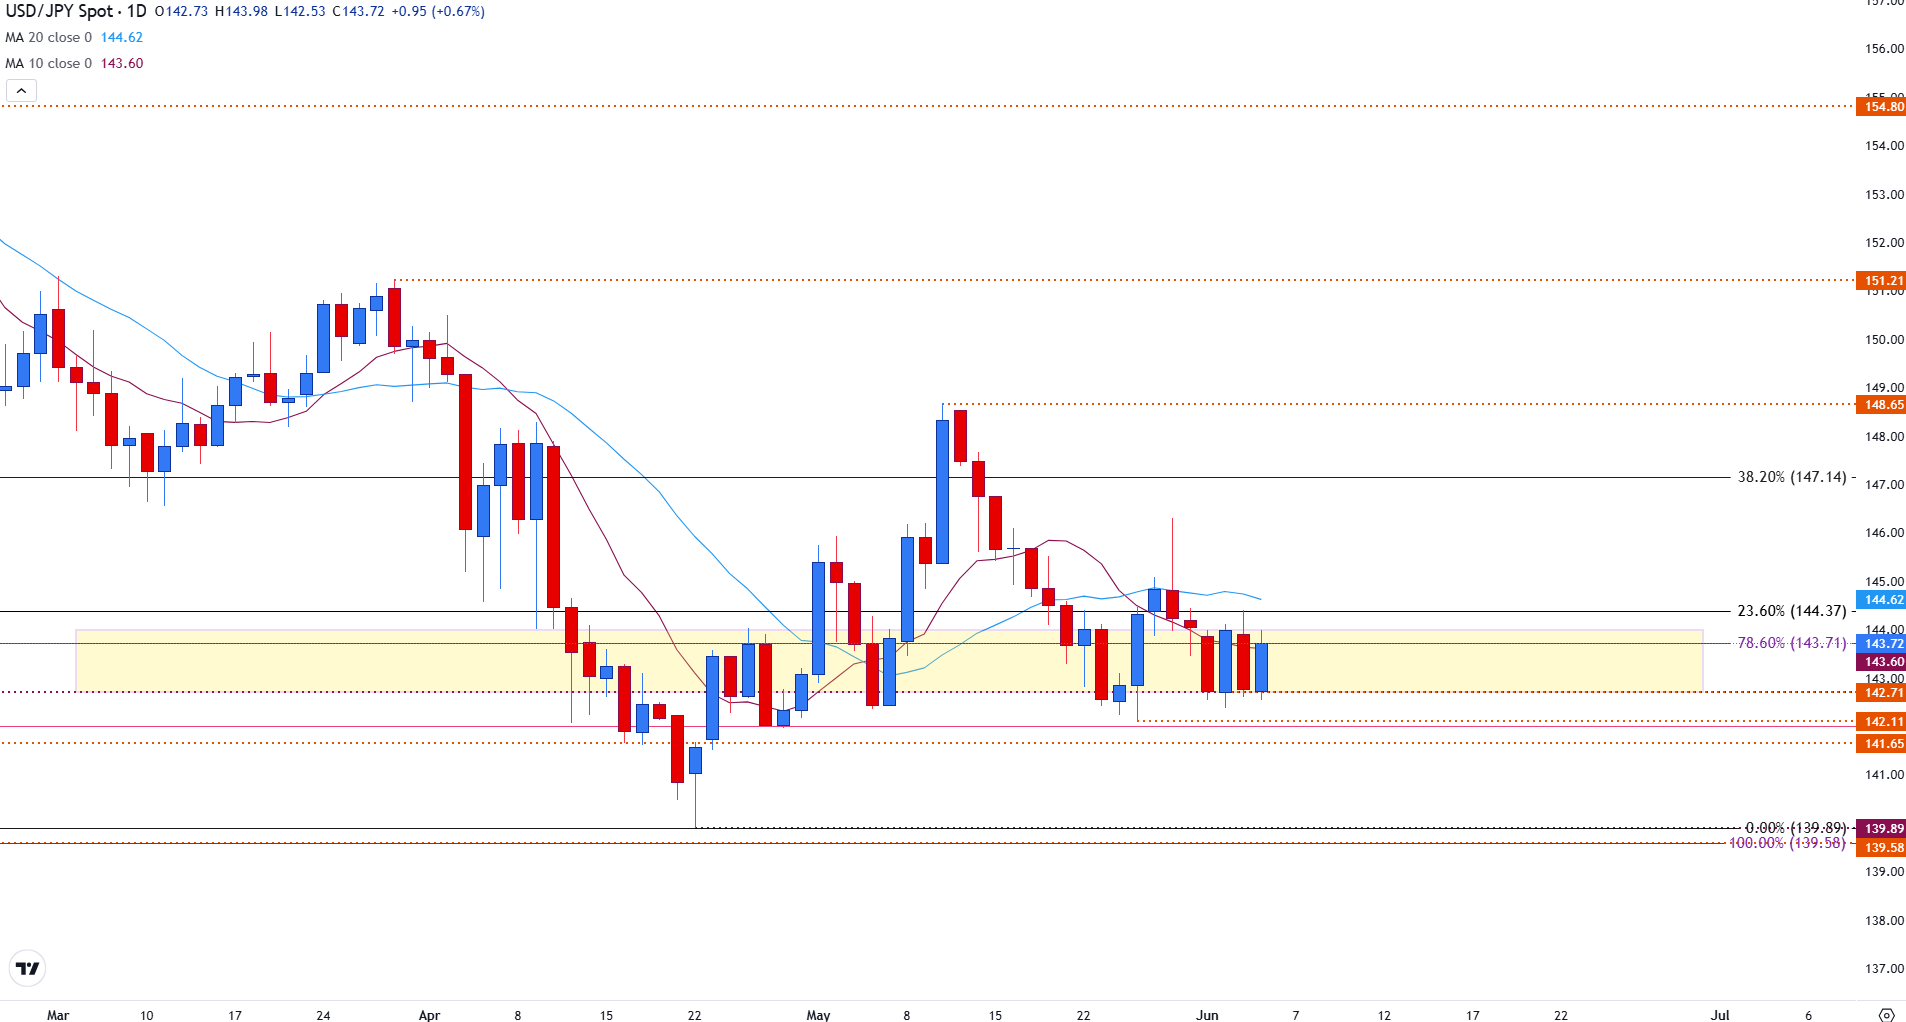
In the short term, USD/JPY remains confined within a tight consolidation range between 142.71 and 143.71.
The lower bound at 142.71 has provided consistent support throughout the week, limiting downside momentum, while the upper bound at 143.71 corresponds with the 78.6% Fibonacci retracement of the September–January rally, acting as firm resistance.
This range has repeatedly served as both support and resistance in recent sessions, establishing it as a key technical zone for near-term directional bias.
The 10-day Simple Moving Average (SMA), currently positioned near 143.60, reinforces the technical importance of the upper boundary, while the 144.00 psychological level looms just above.
A decisive break above 143.71 would open the door for bullish momentum, potentially targeting the next resistance at 144.37 (the 23.6% Fibonacci Retracement level of the January-April decline). Conversely, a break below 142.71 would likely confirm a bearish continuation, exposing psychological support at 142.00 with the October low providing additional support at 141.65.
USD/JPY daily chart
(Click on image to enlarge)
More By This Author:
Silver Prices Surge To Multi-Year Highs, Posting Intraday Gains Near 3.50%Mexican Peso Trades Sideways Against The U.S. Dollar As U.S. Jobs Data Remains In Focus
AUD/USD Firms Near Critical Resistance Ahead Of RBA Meeting Minutes


Comments
Log in or sign up to join the conversation.