

Image Source: Pixabay
- USD/JPY has jumped above 141.00 confidently as the BoJ has continued its expansionary policy.
- BoJ Ueda stated that Japan's headline CPI around 3.5% is due to external, cost-push factors, and cannot be controlled by Japan's monetary policy.
- USD/JPY is approaching 61.8% Fibonacci retracement plotted at 142.63.
The USD/JPY pair showed a V-shape recovery from 140.00 after the Bank of Japan (BoJ) Governor Kazuo Ueda announced an unchanged interest rate decision. BoJ Ueda decided to continue monetary stimulus to spur wages and the overall demand as current inflationary pressures in Japan are majorly contributed by higher import prices.
BoJ Ueda has commented that Japan's headline CPI of around 3.5% is due to external, cost-push factors, and cannot be controlled by Japan's monetary policy.
Meanwhile, the US Dollar Index (DXY) is consistently trading in a narrow range above 102.00 amid an absence of potential triggers ahead.
Economists at ING analyzed the USD Index outlook stating that in the short term, the Dollar may well stay soft against most currencies except the Japanese Yen, with the Bank of Japan remaining resolutely dovish. Here, Yen-funded carry trades will remain popular.
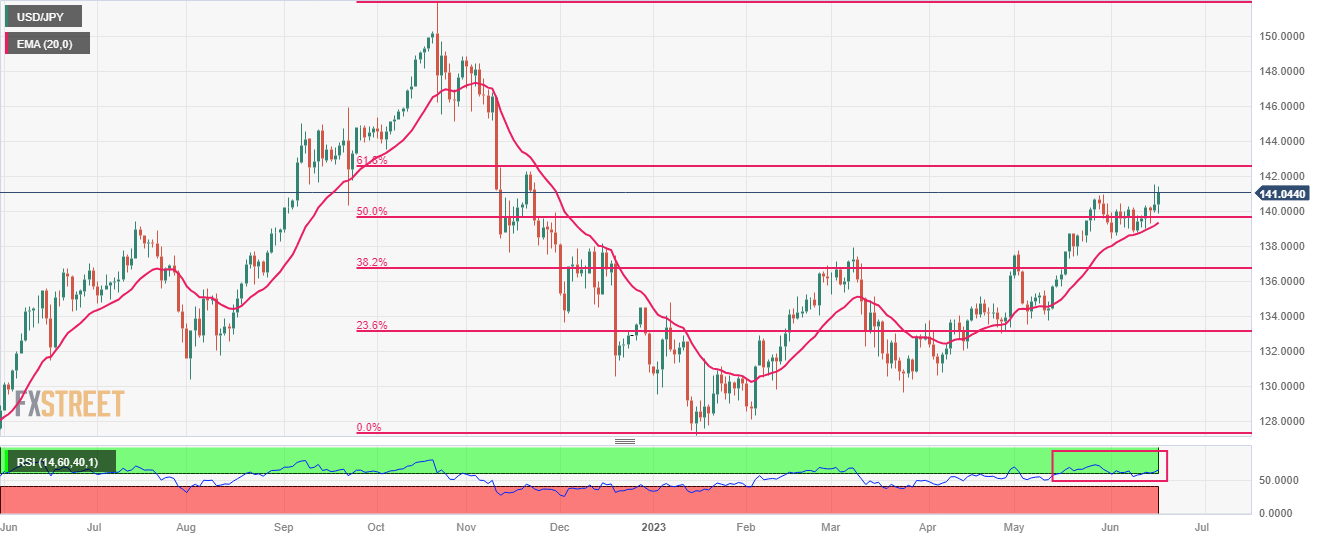
USD/JPY is approaching 61.8% Fibonacci retracement (plotted from 21 October 2022 high at 151.94 to 16 January 2023 low at 127.22) at 142.63 on a daily scale. The asset has refreshed its six-month high at 141.50.
Upward-sloping 20-period Exponential Moving Average (EMA) at 139.38 is providing a cushion to the US Dollar bulls.
The Relative Strength Index (RSI) (14) has shifted into the bullish range of 60.00-80.00, which indicates that the bullish momentum is active.
Going forward, an upside move above a six-month high at 141.50 will drive the asset toward a 61.8% Fibo retracement at 142.58 and 04 October 2022 low at 143.89.
On the flip side, a confident break below June 06 low at 139.09 will drag the asset toward March 08 high at 137.92 followed by March 02 high at 137.10.
USD/JPY daily chart
(Click on image to enlarge)
USD/JPY
| OVERVIEW | |
|---|---|
| Today last price | 141.1 |
| Today Daily Change | 0.75 |
| Today Daily Change % | 0.53 |
| Today daily open | 140.35 |
| TRENDS | |
|---|---|
| Daily SMA20 | 139.58 |
| Daily SMA50 | 136.71 |
| Daily SMA100 | 134.89 |
| Daily SMA200 | 137.24 |
| LEVELS | |
|---|---|
| Previous Daily High | 141.5 |
| Previous Daily Low | 139.94 |
| Previous Weekly High | 140.45 |
| Previous Weekly Low | 138.76 |
| Previous Monthly High | 140.93 |
| Previous Monthly Low | 133.5 |
| Daily Fibonacci 38.2% | 140.91 |
| Daily Fibonacci 61.8% | 140.54 |
| Daily Pivot Point S1 | 139.7 |
| Daily Pivot Point S2 | 139.04 |
| Daily Pivot Point S3 | 138.14 |
| Daily Pivot Point R1 | 141.26 |
| Daily Pivot Point R2 | 142.16 |
| Daily Pivot Point R3 | 142.82 |
More By This Author:
USD/JPY Price Analysis: Bulls Could Be About To Step In Again At Prior ResistanceUS Dollar Index Fails To Capitalize On Upbeat Retail Sales And Falls Sharply Below 103.00
USD/CHF Eases From Daily Top As USD Pares Intraday Gains, Up A Little Around 0.9030 Area


Comments
Log in or sign up to join the conversation.