
Today’s USD/JPY outlook is bullish. Notably, the US dollar reached a fresh high of 147.875 yen on Thursday, marking its highest since last November. This increase came due to unexpected strength in the US services sector in August. Consequently, this indicated ongoing inflation pressures.
![]()
The Institute for Supply Management said last month’s non-manufacturing Purchasing Managers’ Index rose to 54.5. This is the highest reading since February, up from July’s 52.7. A PMI reading above 50 signifies growth in the services sector, which constitutes over two-thirds of the US economy.
Moreover, Analyst Kirstine Kundby-Nielsen from Danske Bank noted that the stronger-than-expected ISM services data reinforced the narrative of US economic outperformance. Therefore, it lent broad support to the US dollar.
Meanwhile, the Federal Reserve’s “Beige Book,” published on Wednesday, revealed that US economic growth had been modest recently. Additionally, job growth was subdued, and inflation had slowed in most regions.
Market expectations indicate a greater than 40% probability of the Fed implementing another rate hike in November. However, policymakers are expected to maintain interest rates at the current levels later this month.
Meanwhile, in Japan, traders remained vigilant for potential currency intervention. Even as officials warned against a yen sell-off, Bank of Japan policymaker Junko Nakagawa emphasized the importance of retaining ultra-loose monetary policy. Moreover, she suggested that the central bank was in no hurry to phase out its extensive stimulus program.
USD/JPY key events today
The US will release its weekly employment report on initial jobless claims. This will give inventors an idea of the current state of the US labor market.
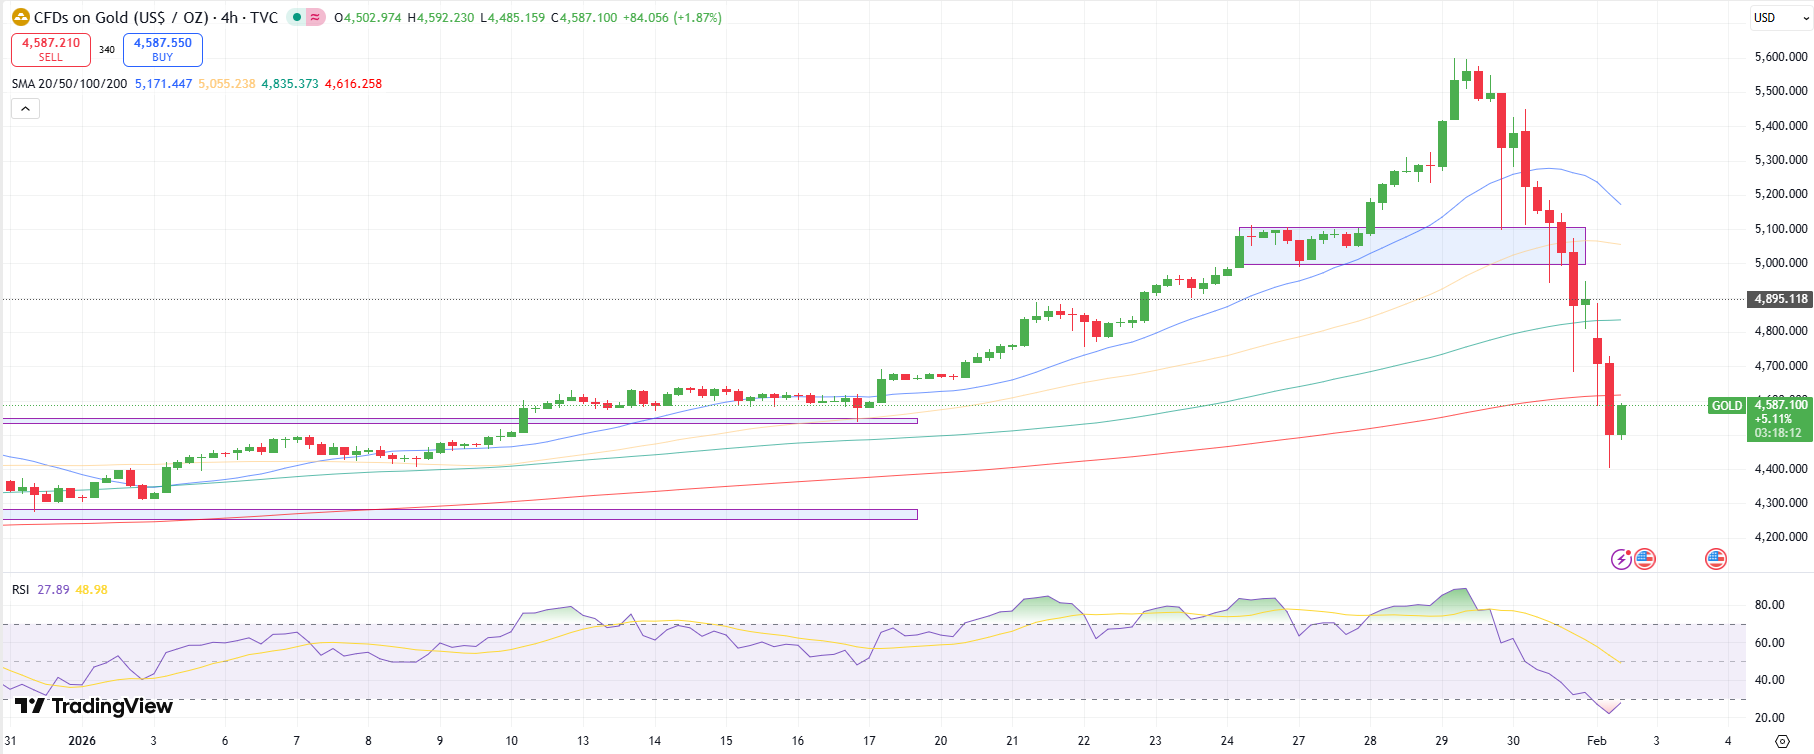
USD/JPY technical outlook: Bearish signs emerge as price pauses below 148.00.

USD/JPY 4-hour chart
The USD/JPY pair has made new highs as the bullish trend persists. However, the price has failed to reach the 148.00 resistance level. On a larger scale, the price has been making higher highs and lows, a sign of a bullish trend. However, it has also been chopping through the 30-SMA, indicating a shallow trend.
The price shows some weakness below 148.00 as the RSI has made a bearish divergence. If it plays out, we could see a break below the 30-SMA.
More By This Author:
USD/CAD Forecast: CAD Struggles as BoC Unchanged at 5%USD/CAD Price Stays Bid Ahead Of BoC Rate Decision
AUD/USD Price Analysis: Aussie Recovers On Q2 GDP Data

Comments
Log in or sign up to join the conversation.