USD/CHF Drifting Into The Low Side Ahead Of Next Week's Us Inflation Data
The USD/CHF tracked lower on Friday as broader markets saw an uptick in risk appetite to close out the trading week, bringing the US Dollar (USD) down into familiar lows against the Swiss Franc (CHF) with the 0.8800 handle in full view.
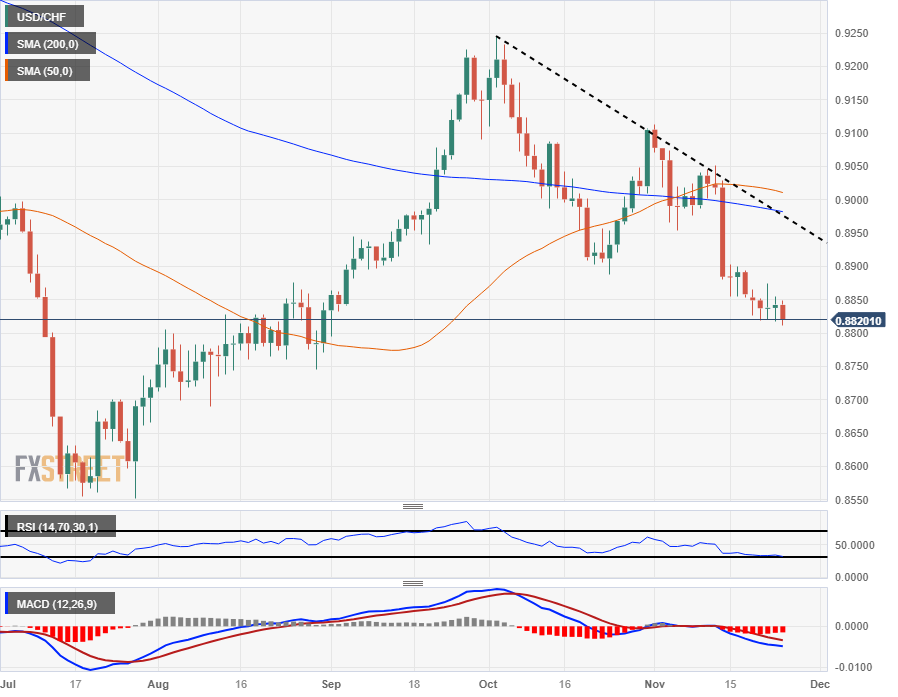
The pair traded mostly flat for the week with a brief push into a high of 0.8874 while Friday saw the week's low etched in at 0.8811.
Next week sees a relatively sedate economic calendar before high-impact US data hits markets in the mid-week, with US Gross Domestic Product (GDP) scheduled for Wednesday and Personal Consumption Expenditure (PCE) inflation figures slated for Thursday.
An array of US market data due in the latter half of next week
Annualized US quarterly GDP is expected to tick upwards slightly from 4.9% to 5.0%, and US PCE for the month of October is forecast to drop slightly from 0.3% to 0.2%.
Next week will close out market action with Swiss quarterly GDP and US ISM Purchasing Managers' Index (PMI) numbers both slated for Friday, December 1st.
Swiss GDP is broadly expected to hold flat for the third quarter at 0.0%, while the US ISM Manufacturing PMI for November is forecast to tick upwards from 46.7 to 47.6.
Federal Reserve (Fed) Chairman Jerome Powell will also be making an appearance next Friday. The head of the Fed will be participating in an informal discussion labeled "Navigating Pathways to Economic Mobility" at the Spelman College of Atlanta.
USD/CHF Technical Outlook
The USD/CHF's Friday dip sets the pair up for a fresh downside run at the 0.8800 handle, and technical support is looking thin in the near-term, with the nearest firm barrier seen at July's low bids near 0.8550.
On the top end, a series of lower highs is drawing in a descending trendline from October's early swing high into 0.9250, which looks set to provide technical resistance looking ahead.
The 200-day Simple Moving Average (SMA) is trending down below just below the major 0.9000 handle, capping off any strong topside bullish recoveries, while the 50-day SMA is rotating into a bearish stance from just above 0.9000.
USD/CHF Daily Chart

USD/CHF Technical Levels
| OVERVIEW | |
|---|---|
| Today last price | 0.882 |
| Today Daily Change | -0.0022 |
| Today Daily Change % | -0.25 |
| Today daily open | 0.8842 |
| TRENDS | |
|---|---|
| Daily SMA20 | 0.8962 |
| Daily SMA50 | 0.9014 |
| Daily SMA100 | 0.8894 |
| Daily SMA200 | 0.8984 |
| LEVELS | |
|---|---|
| Previous Daily High | 0.8855 |
| Previous Daily Low | 0.8817 |
| Previous Weekly High | 0.9052 |
| Previous Weekly Low | 0.8853 |
| Previous Monthly High | 0.9244 |
| Previous Monthly Low | 0.8888 |
| Daily Fibonacci 38.2% | 0.884 |
| Daily Fibonacci 61.8% | 0.8832 |
| Daily Pivot Point S1 | 0.8821 |
| Daily Pivot Point S2 | 0.8801 |
| Daily Pivot Point S3 | 0.8784 |
| Daily Pivot Point R1 | 0.8859 |
| Daily Pivot Point R2 | 0.8876 |
| Daily Pivot Point R3 | 0.8896 |
More By This Author:
Advanced Micro Devices Stock Forecast: AMD Closes Fourth Consecutive Week Higher
GBP/USD Hits 12-Week High Amid Positive Data
Forex Today: Dollar Remained Vulnerable, Focus Turned To Inflation Data
Disclosure: Information on this article contains forward-looking statements that involve risks and uncertainties. Markets and instruments profiled on this page are for informational purposes ...
more


