
USD/CAD Weekly Forecast: Down GDP Urges For June Rate Cut
The USD/CAD weekly forecast shows a slowdown in the US economy that could pressure the Fed to cut rates in June.
Ups and downs of USD/CAD
The USD/CAD price had a bearish week as most US economic reports signaled an economic slowdown. However, the dollar briefly rebounded on Friday after an upbeat jobs report.
Throughout the week, US data pointed to weakness, with vacancies, jobless claims and private employment all missing forecasts. However, the economy added 177,000 jobs in April, above estimates of 138,000. Still, it was slower than the previous reading of 185,000.
Meanwhile, the Canadian economy unexpectedly contracted by 0.2%, increasing pressure on the Bank of Canada to resume its easing cycle.
Next week’s key events for USD/CAD
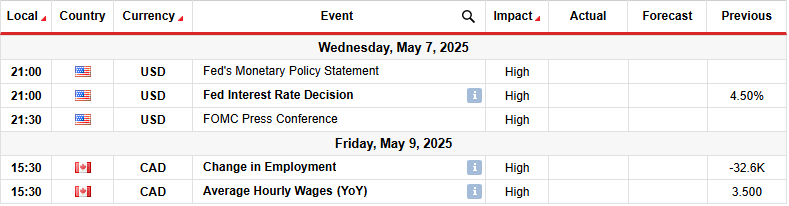
Next week, market participants will focus on the FOMC policy meeting. Meanwhile, Canada will release its crucial monthly employment report. The Fed will likely keep interest rates unchanged as policymakers wait for more evidence of a deteriorating economy. Data on Friday revealed that the labor market remains stronger than expected. However, traders are increasingly pricing a rate cut in June.
Meanwhile, Canada’s employment report will show the state of its labor market, shaping the outlook for Bank of Canada rate cuts.
USD/CAD weekly technical forecast: Bears lose momentum near channel support

USD/CAD daily chart
On the technical side, the USD/CAD price trades below the 22-SMA with the RSI under 50, indicating a bearish bias. Since its peak at the top of the chart, the price has made lower highs and lows. At the same time, it has respected solid resistance and support lines, creating a bearish channel.
At the moment, bears are challenging the 1.3800 support level. However, price action shows the decline has weakened near the channel support. The candle bodies are smaller. At the same time, the RSI has made a bullish divergence, suggesting fading momentum.
If bulls return, the price will likely break above the SMA to retest the channel resistance and the 1.4200 level. The decline will continue as long as the price remains in the channel. The next target will be at the 1.3400 level. On the other hand, a bullish channel breakout would signal a bullish shift in sentiment.
More By This Author:
GBP/USD Weekly Forecast: Strong NFP Justifies Cautious FedGBP/USD Forecast: Pound Poised For Solid Monthly Gains
USD/JPY Price Analysis: Auto Tariff Easing Boosts Sentiment
Disclaimer: Foreign exchange (Forex) trading carries a high level of risk and may not be suitable for all investors. The risk grows as the leverage is higher. Investment objectives, risk ...
more

