
The sharp advance in USD/CAD has materialized following the failed attempts to push below the 50-Day SMA (1.2834), and the exchange rate may start to track the positive slope in the moving average as the Federal Reserve normalizes monetary policy faster than its Canadian counterpart.
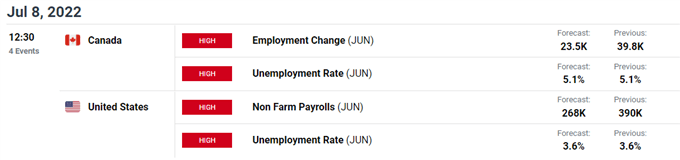
As a result, the employment reports coming out of the US and Canada may do little to derail the recent advance in USD/CAD as the Federal Open Market Committee (FOMC) and Bank of Canada (BoC) remain on track to implement higher interest rates, and the exchange rate may continue to trade to fresh yearly highs in July with Chairman Jerome Powell and Co. expected to deliver another 75bp rate hike later this month.
Meanwhile, the BoC may opt for a 50bp rate hike as “the Governing Council continues to judge that interest rates will need to rise further,” but it remains to be seen if Governor Tiff Macklem and Co. will adjust the forward guidance for monetary policy as the central bank is slated to release the updated Monetary Policy Report (MRP) at its next meeting on July 13.
Until then, USD/CAD may largely track the weakness in commodity bloc currencies as the 50bp rate hike from the Reserve Bank of Australia (RBA) does little to shore up the Australian Dollar, but the tilt in retail sentiment may persist as positioning appears to be mirroring the behavior seen in May.
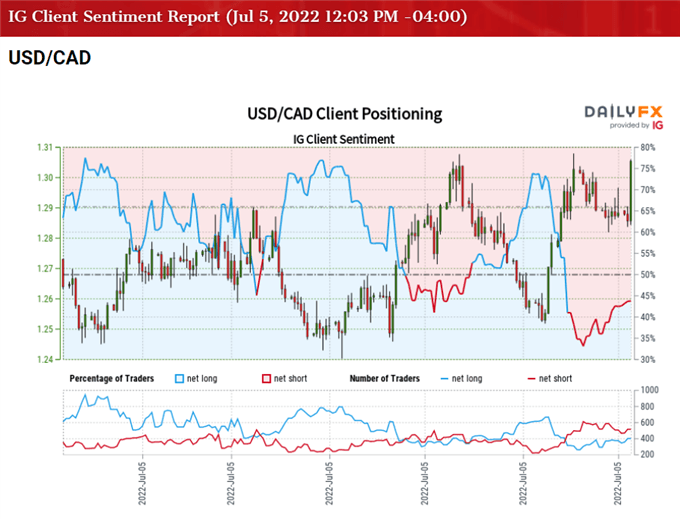
The IG Client Sentiment Report shows 41.53% of traders are currently net-long USD/CAD, with the ratio of traders short to long-standing at 1.41 to 1.
The number of traders net-long is 16.62% lower than yesterday and 17.25% lower from last week, while the number of traders net-short is 7.91% lower than yesterday and 20.07% lower from last week. The decline in net-long position comes as USD/CAD trades to a fresh yearly high (1.2843), while the drop in net-short interest has helped to alleviate the crowding behavior as 40.69% of traders were net-long the pair last week.
With that said, USD/CAD may mimic the price action from May if the recent advance fails to push the Relative Strength Index (RSI) into overbought territory, but a move above 70 in the oscillator is likely to be accompanied by a further advance in the exchange rate like the price action seen during the previous year.
USD/CAD RATE DAILY CHART
(Click on image to enlarge)
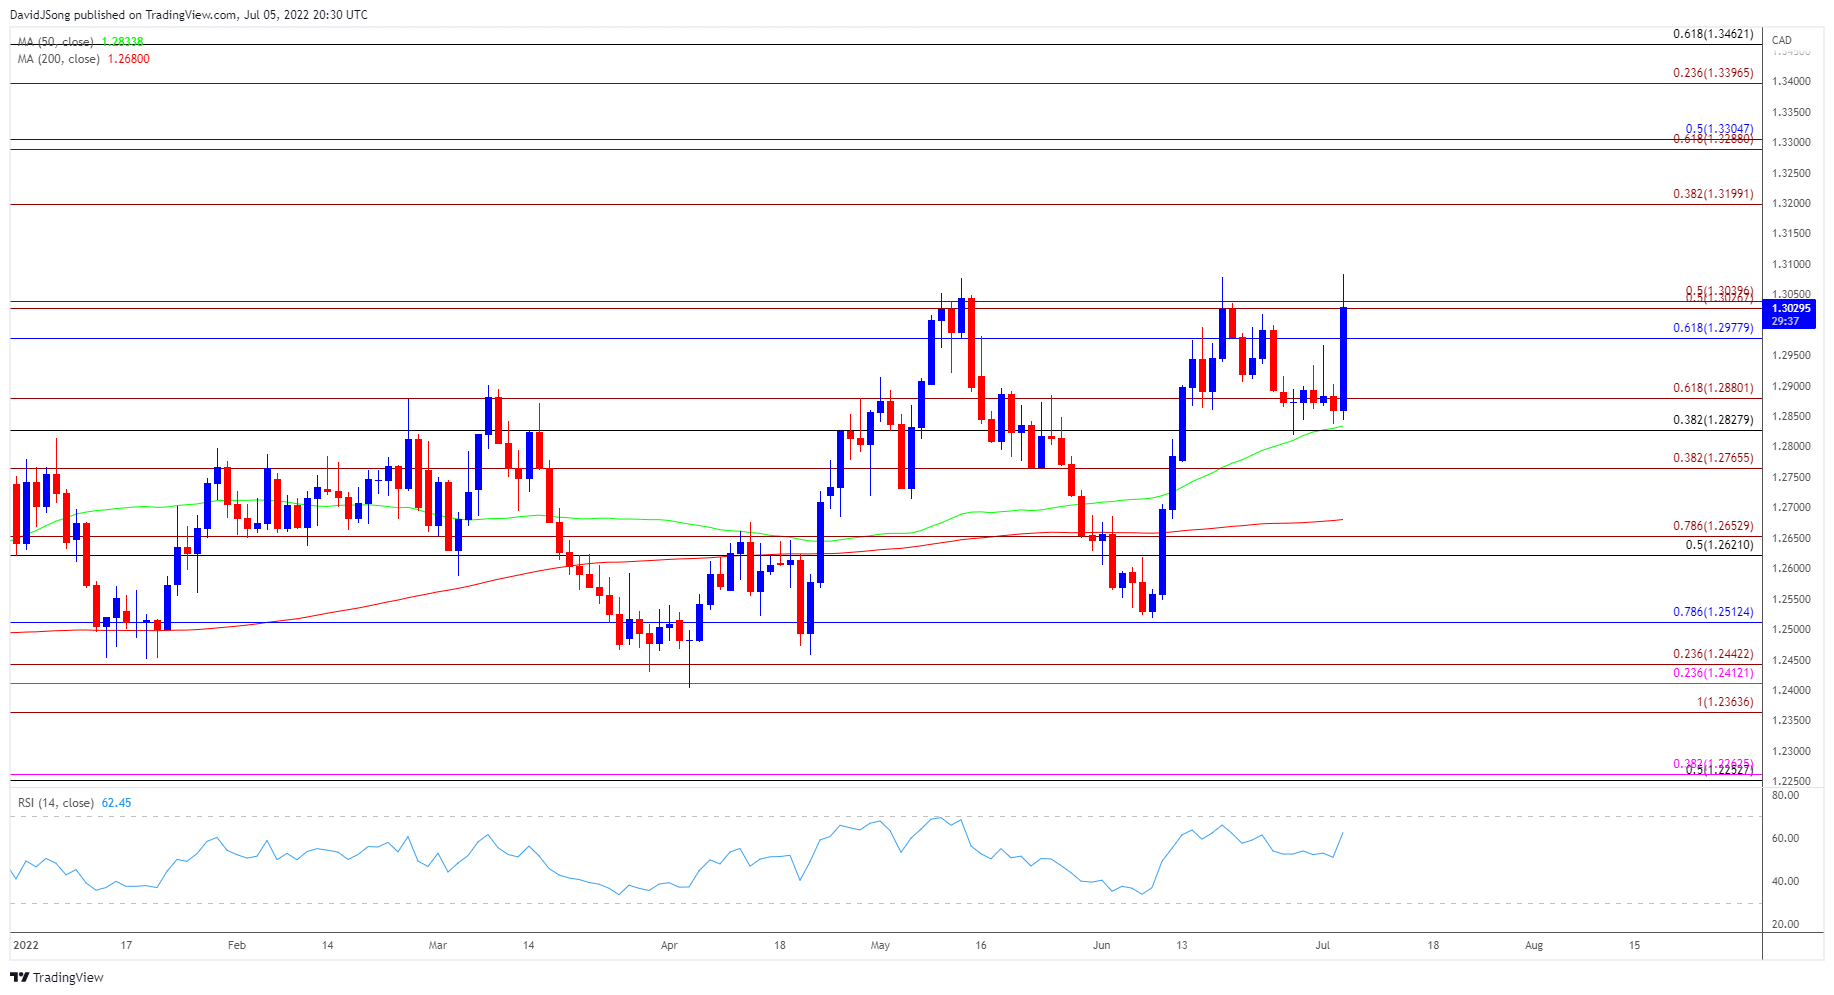
Source: Trading View
- USD/CAD manages to clear the June range as it trades to a fresh yearly high (1.3083), but need a close above the 1.3030 (50% expansion) to 1.3040 (50% expansion) region to bring the 1.3200 (38.2% expansion) handle on the radar.
- Looming developments in the Relative Strength Index (RSI) may show the bullish momentum gathering pace if the oscillator climbs above 70 for the first time in 2022, but failure to push into overbought territory may lead USD/CAD to mirror the price action from May especially if it struggles to hold above the 1.3030 (50% expansion) to 1.3040 (50% expansion) region.
- A move below the 1.2980 (61.8% retracement) area may push USD/CAD back towards the Fibonacci overlap around 1.2830 (38.2% retracement) to 1.2880 (61.8% expansion), which lines up with the 50-Day SMA (1.2834), with the next region of interest coming in around 1.2770 (38.2% expansion).
More By This Author:
Crude Oil Price Eyes Monthly Low as OPEC Retains Adjusted Output Schedule
USD/CAD Forecast: Decline From June High Mirrors Price Action From May
NZD/USD Forecast: Rebound From Yearly Low Stalls Ahead Of 50-Day SMA


Comments
Log in or sign up to join the conversation.