
Unlocking The Success Code Asian Paint Indian Stocks Elliott Wave Technical Analysis
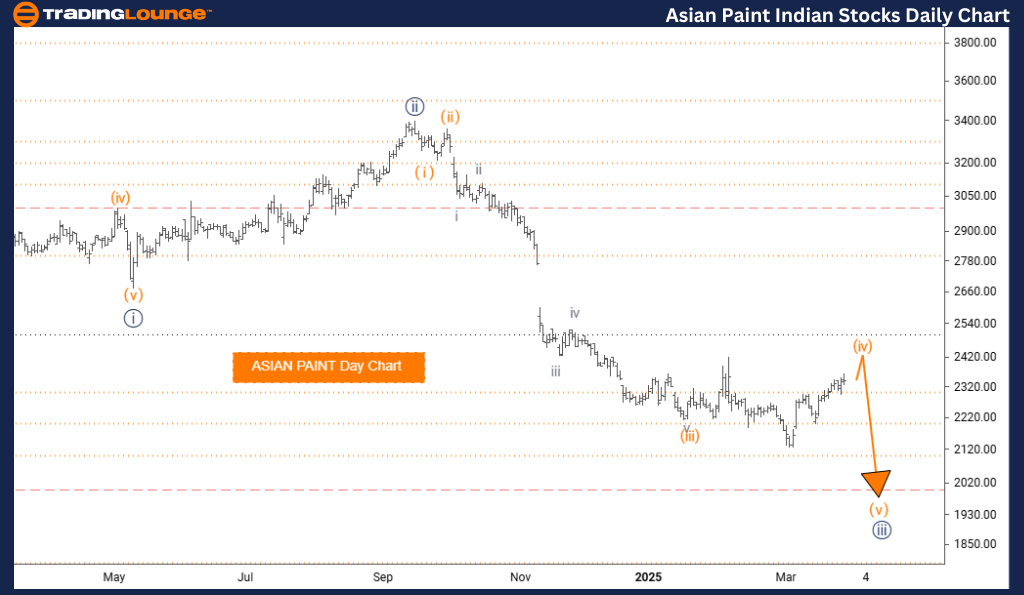
ASIAN PAINT Elliott Wave Analysis – Trading Lounge Day Chart
ASIAN PAINT Elliott Wave Technical Analysis
- Function: Counter Trend
- Mode: Corrective
- Structure: Orange Wave 4
- Position: Navy Blue Wave 3
- Direction (Next Lower Degrees): Orange Wave 5
-
Details: Orange Wave 3 appears complete; Orange Wave 4 is now active
Daily Chart Overview:
The Elliott Wave analysis for ASIAN PAINT's daily chart outlines a counter-trend outlook, identifying a corrective phase in progress. The focus is on Orange Wave 4, forming part of the broader Navy Blue Wave 3 in the wave sequence. With the impulsive movement of Orange Wave 3 now concluded, the stock is transitioning into a temporary corrective phase under Orange Wave 4.
Wave Structure Insight:
This counter-trend development indicates a brief pause in the dominant market direction before resuming its trend. The daily timeframe offers clarity into this evolving structure, supporting better decision-making based on the current market stage. Once the Orange Wave 4 correction completes, the stock is expected to begin Orange Wave 5, resuming its previous upward momentum.
Technical Note:
The analysis highlights the relationship between wave degrees, positioning Orange Wave 4 as both a short-term opportunity and a structural element within Navy Blue Wave 3. Traders should observe typical corrective characteristics such as three-wave patterns or sideways consolidations during this phase.
Conclusion:
Traders are advised to wait for confirmation of corrective wave completion before anticipating a significant move in ASIAN PAINT shares. The current pullback phase may offer opportunities for both short-term trades and long-term entries aligned with the larger trend direction.
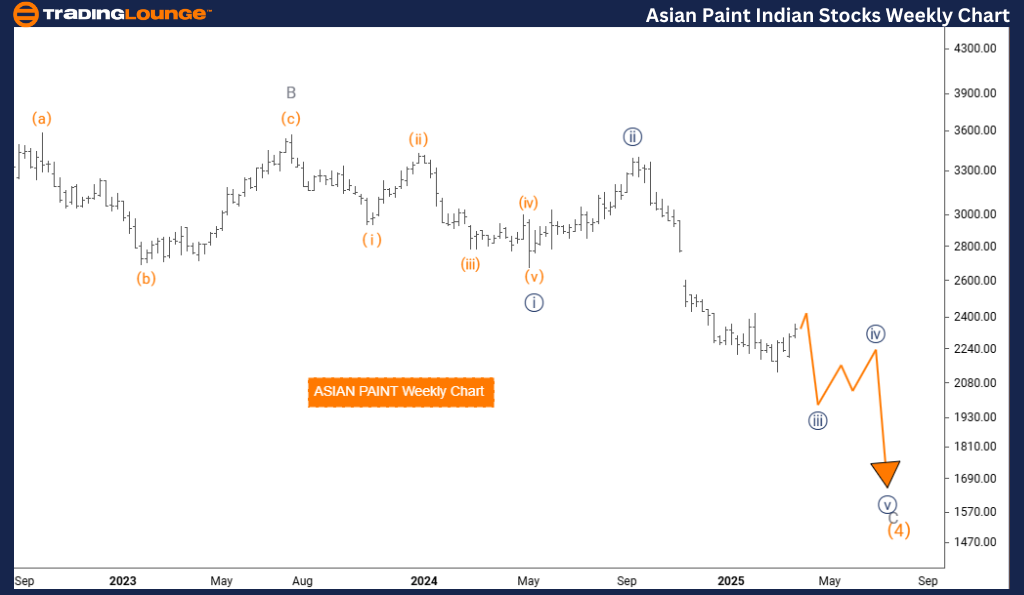
ASIAN PAINT Elliott Wave Analysis – Trading Lounge Weekly Chart
ASIAN PAINT Elliott Wave Technical Analysis
- Function: Counter Trend
- Mode: Impulsive
- Structure: Navy Blue Wave 3
- Position: Gray Wave C of 4
- Direction (Next Higher Degrees): Navy Blue Wave 4
- Details: Navy Blue Wave 3 appears complete; it is currently unfolding further
Weekly Chart Overview:
The Elliott Wave analysis for ASIAN PAINT's weekly chart outlines a counter-trend setup with a potentially bullish outlook. The central focus is on Navy Blue Wave 3, which is developing within the broader Gray Wave C of Orange Wave 4 structure. With Navy Blue Wave 3 having likely completed its previous segment, the stock appears to be continuing within the same wave count, indicating a complex corrective phase.
Wave Structure Insight:
The weekly timeframe offers a broader perspective, showing Navy Blue Wave 3 evolving within Gray Wave C. This counter-trend phase displays impulsive characteristics, which are occasionally found in Wave C positions during corrections. Upon completing the current structure, the stock is expected to move into Navy Blue Wave 4—a corrective phase that may precede continued trend progression.
Technical Note:
This analysis highlights the intricate relationships between different wave degrees. Navy Blue Wave 3 plays a dual role—both as an immediate pattern to watch and as a segment within a larger correction. Investors should monitor for completion signals of the current wave, which may provide clues for the next significant move in ASIAN PAINT shares.
Conclusion:
The weekly chart provides useful insights for position traders, offering clarity on short-term trade setups and long-term trend alignment. ASIAN PAINT is likely in a complex wave phase, and recognizing this structure can help traders better time their market entries and exits.
Technical Analyst: Malik Awais
More By This Author:
Elliott Wave Technical Analysis: Binance Crypto Price
Elliott Wave Insights And Strategies For SP500, Nasdaq, Top Tech Stocks
Elliott Wave Technical Forecast: News Corporation - Friday, March 28
At TradingLounge™, we provide actionable Elliott Wave analysis across over 200 markets. Access live chat rooms, advanced AI & algorithmic charting tools, and curated trade ...
more

