Unlocking ASX Trading Success: Car Group Limited - Monday, May 19
ASX: CAR GROUP LIMITED – CAR
Elliott Wave Technical Analysis
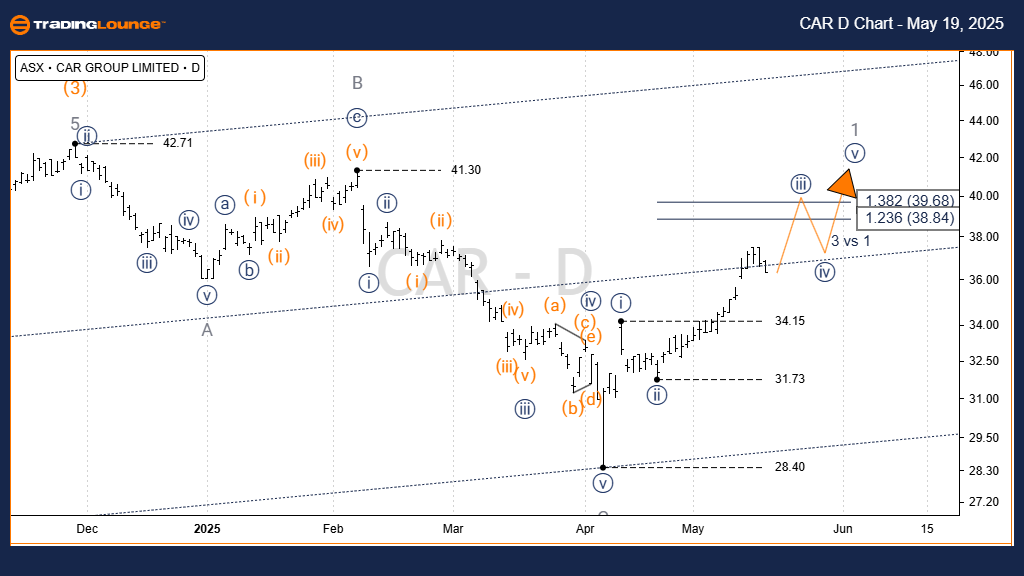
Today’s Elliott Wave review covers CAR GROUP LIMITED (ASX:CAR), listed on the Australian Stock Exchange. Based on our current chart patterns, it appears that the stock has recently completed a corrective wave labeled (4) – orange, in the form of a Zigzag pattern. This may indicate an upward trend could follow, opening up potential for bullish movement. This brief technical outlook outlines the forecasted direction and the critical price points that support this wave structure.
ASX: CAR GROUP LIMITED – CAR
Elliott Wave Technical Analysis
1D Chart (Semilog Scale) Review
-
Function: Intermediate trend (orange label)
-
Mode: Motive
-
Structure: Impulse
-
Current Wave Position: Wave iii)) – navy, within Wave (5) – orange
Analysis Overview:
Wave (4) – orange likely concluded at the $28.40 level, forming a Zigzag pattern with subwaves A, B, and C (grey). Subwave C counts as a completed five-wave move, suggesting it has finalized. This supports the idea that Wave (5) – orange is now underway. The ongoing movement in wave iii)) – navy is targeting the resistance zone between $39.68 and $40.00.
Invalidation Point:
If the price dips below $31.73, this wave outlook would need to be reassessed.

ASX: CAR GROUP LIMITED – CAR
Elliott Wave Technical Analysis
TradingLounge (4-Hour Chart)
-
Function: Minor trend (grey label)
-
Mode: Motive
-
Structure: Impulse
-
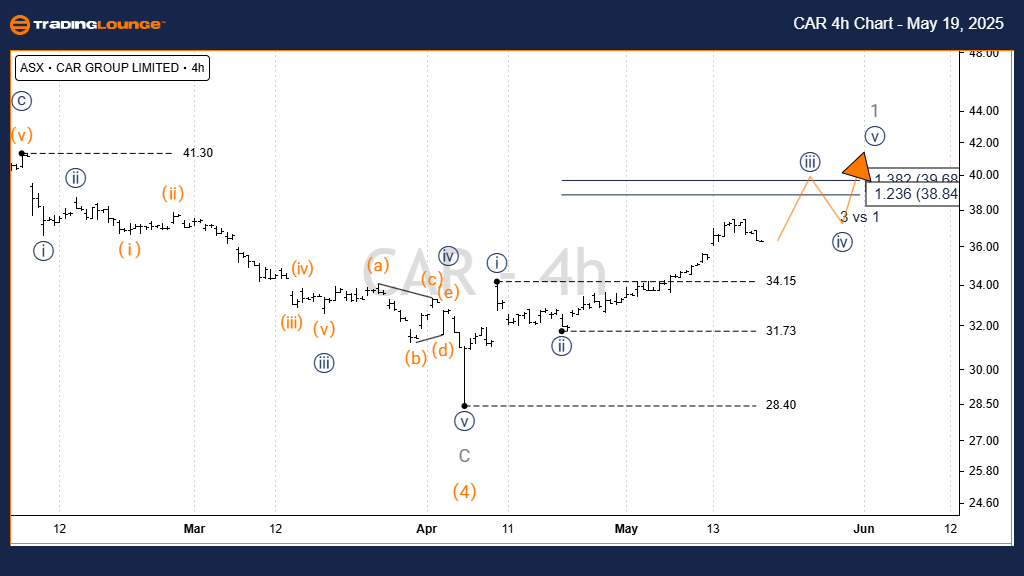
Current Wave Position: Wave ((iii)) – navy of Wave (5) – orange
Chart Focus:
From the $31.73 high, wave iii)) – navy is progressing upward. Holding above $31.73 is essential to validate this interpretation.
Invalidation Point:
A decline below $31.73 would require the wave count to be revisited.

Conclusion:
This Elliott Wave analysis for ASX: CAR GROUP LIMITED (CAR) highlights key insights into potential future trends and entry points. The levels shared serve as crucial reference markers for either confirming or invalidating the current forecast. These technical signals help reinforce confidence in the Elliott Wave reading and serve as a guide for strategic market positioning.
Technical Analyst: Hua (Shane) Cuong, CEWA-M
More By This Author:
Trading Strategies For Tech Stocks & Bitcoin
Unlocking ASX Trading Success: Insurance Australia Group Limited - Friday, May 16
Elliott Wave Technical Analysis: British Pound/ U.S. Dollar - Friday, May 16
At TradingLounge™, we provide actionable Elliott Wave analysis across over 200 markets. Access live chat rooms, advanced AI & algorithmic charting tools, and curated trade ...
more


