Two Trades To Watch: EUR/GBP, Tesla - Wednesday, Oct. 20
GBP/EUR edges higher with inflation in focus. Tesla reports Q3 earnings after the close.

GBP/EUR edges higher with inflation in focus
GBP/EUR is attempting to claw higher after UK CPI inflation missed forecasts. UK CPI printed at 3.1% in September down from 3.1% and short of forecasts of 3.2%. However, this remains well above the BoE’s 2% target.
Eurozone inflation is very much in focus with German PPI expected to show 12.7% YoY rise in September, up from 12% in August.
Eurozone CPI is also due; this is a final revision so potentially not as market moving. Expectations are for 1.9% YoY rise, up from 1.6% in August. ECB speakers will also be in focus.
Any gains in the Euro could be limited owing to the dovish ECB (EZU, FXB, FXE)
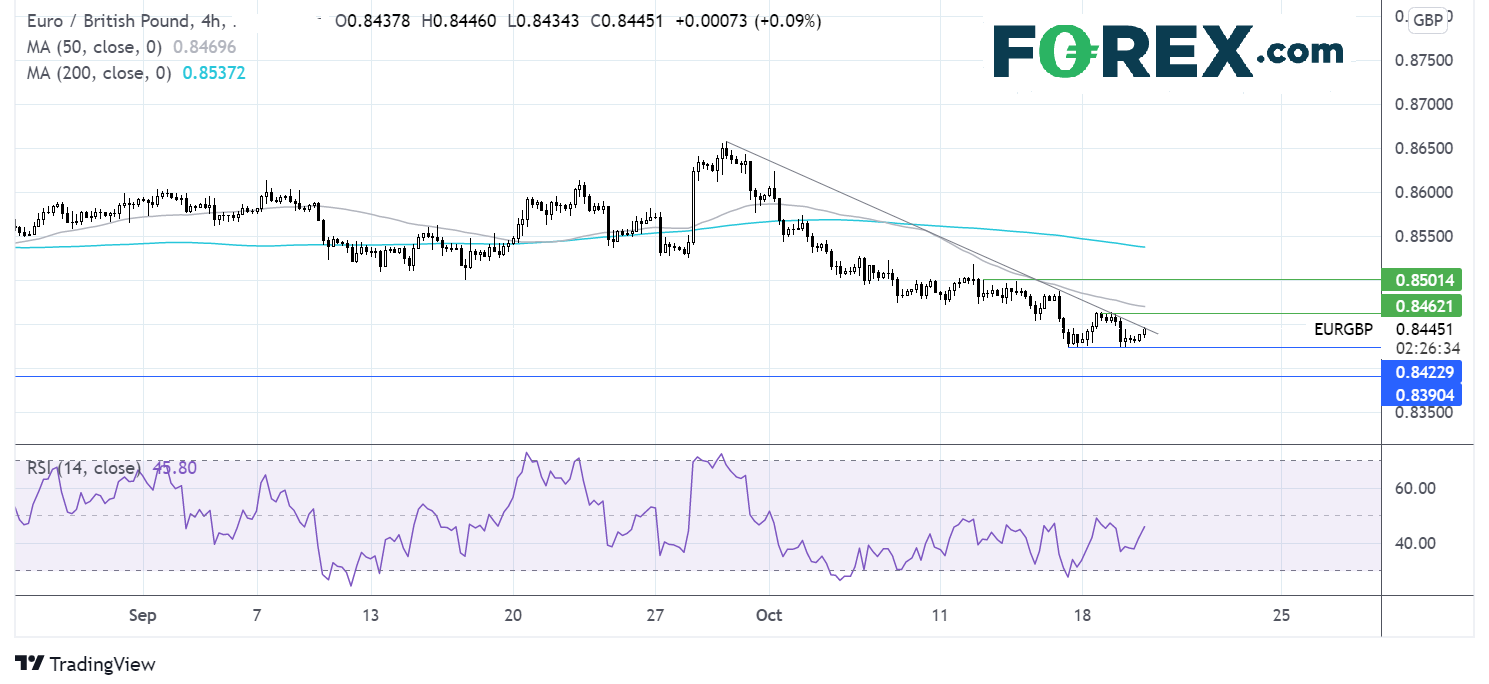
Where next for EUR/GBP?
EURGBP trades below its 50 & 200 sma on the 4 hour chart and below its falling trendline dating back to late September. The price has found a floor for now at 0.8423, the October low.
The RSI is pointing higher but remains in bearish territory suggesting that this could be a corrective pick up.
The pair is approaching the falling trendline resistance at 0.8445, bringing the weekly high of 0.8460 into focus and exposing the 50 sma at 0.8465. A move above here would negate the near-term bearish bias. It would take a move above 0.85 horizontal resistance for buyers to gain traction.
Rejection at the trendline resistance could see the pair retest 0.8425 bringing 0.8390 the January ’20 low into play.
Tesla Q3 earnings after the close.
Tesla (TSLA) is due to report after the market close. Tesla has already disclosed deliveries of 241,300 in Q3 a new record, up 20% on the previous quarter.
Thanks to the delivery numbers, revenue is expected at around $14.005 billion.
Whilst Tesla reinvests most of its money into growth, a profit is still expected. EPS is expected at $1.59.
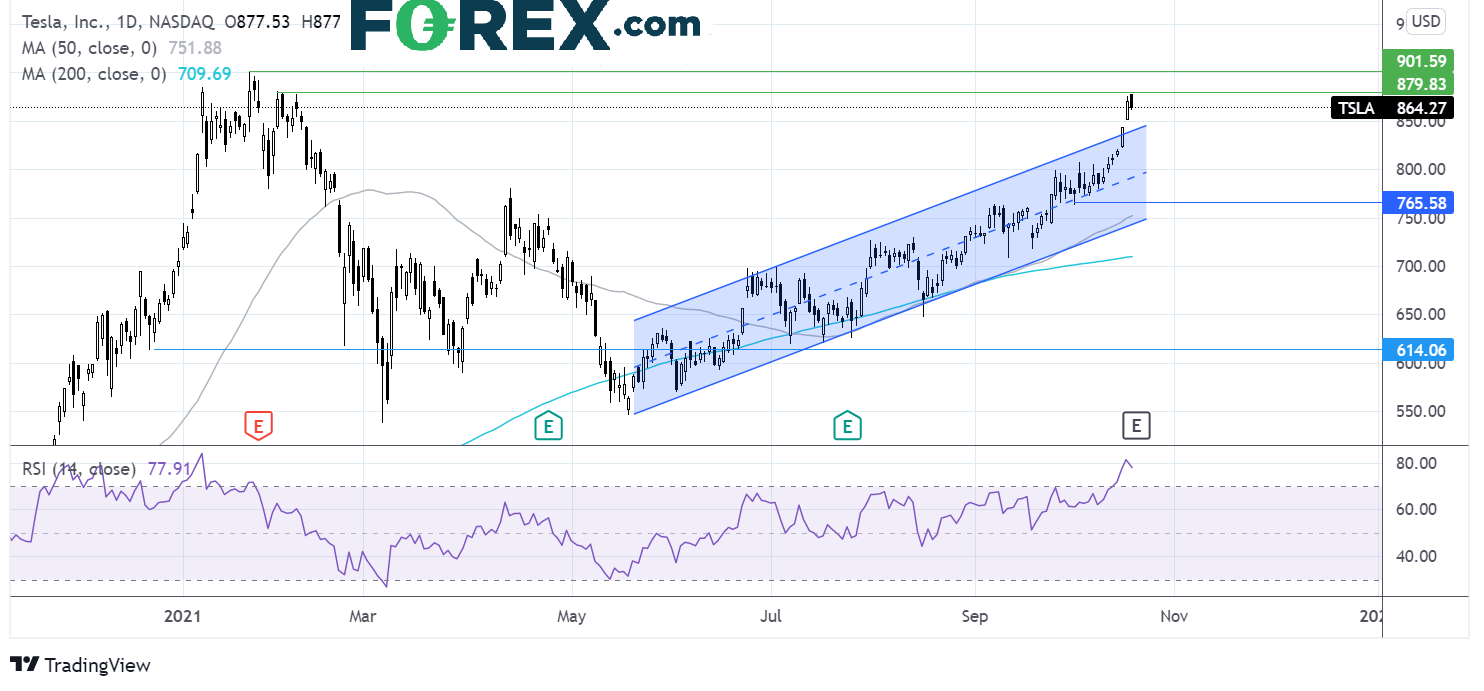
Where next for Tesla share price?
Tesla has broken out of its ascending dating back to mid-May. It trades above its 50 & 200 sma in a clearly bullish chart.
The RSI is firmly in overbought territory some consolidation or an ease back at some point could be on the cards.
Tesla is has been probing a key resistance level at $870 -$880 the February high. A close above this level could cement the way towards $900 and fresh all-time highs.
Meanwhile, it would take a fall below $765 to change the bullish bias and for bears to gain traction towards $740 the 50 sma and the lower band of the rising channel.