
Top 5 Events: Q1’19 UK GDP & GBPUSD Price Forecast
05/10 FRIDAY | 08:30 GMT | GBP GROSS DOMESTIC PRODUCT (1Q P)
Brexit tensions may have settled down in recent weeks after the deadline was pushed back to October 31, 2019. But before then, there were signs that the UK economy was finding its footing, in line with developments seen across the developed world. Given data from G7 economies, it appears that global growth hit a rut at the end of January and the beginning of February, before ending Q1’19 on a stronger footing.
Data from the end of the first quarter showed noticeable improvement, particularly relative to one year prior: March UK industrial production grew by 0.5%, up from 0.1% in February (y/y); and March UK manufacturing production grew by 1.1%, up from 0.6% in February (y/y). Meanwhile, March UK retail sales (ex-auto fuel) added 6.2% over the prior month after growing by 3.8% in February; as the US economy, the UK economy is highly dependent on consumption to fuel growth trends.
Overall, the Citi Economic Surprise Index for the UK, a gauge of economic data momentum, gained from -25.3 to 16.4 over the course of the first quarter. Accordingly, the Bloomberg News consensus forecast for the Q1’19 UK GDP report calls for quarterly growth at 0.5% from 0.2% and yearly growth at 1.8% from 1.4%. If the Q1’19 UK GDP report comes in at 1.8% y/y, this will be the fastest rate of growth for the UK since Q4’17 (1.8% as well).
Pairs to Watch: EURGBP, GBPJPY, GBPUSD
GBPUSD TECHNICAL ANALYSIS: DAILY TIMEFRAME (JUNE 2018 TO MAY 2019) (CHART 1)
(Click on image to enlarge)
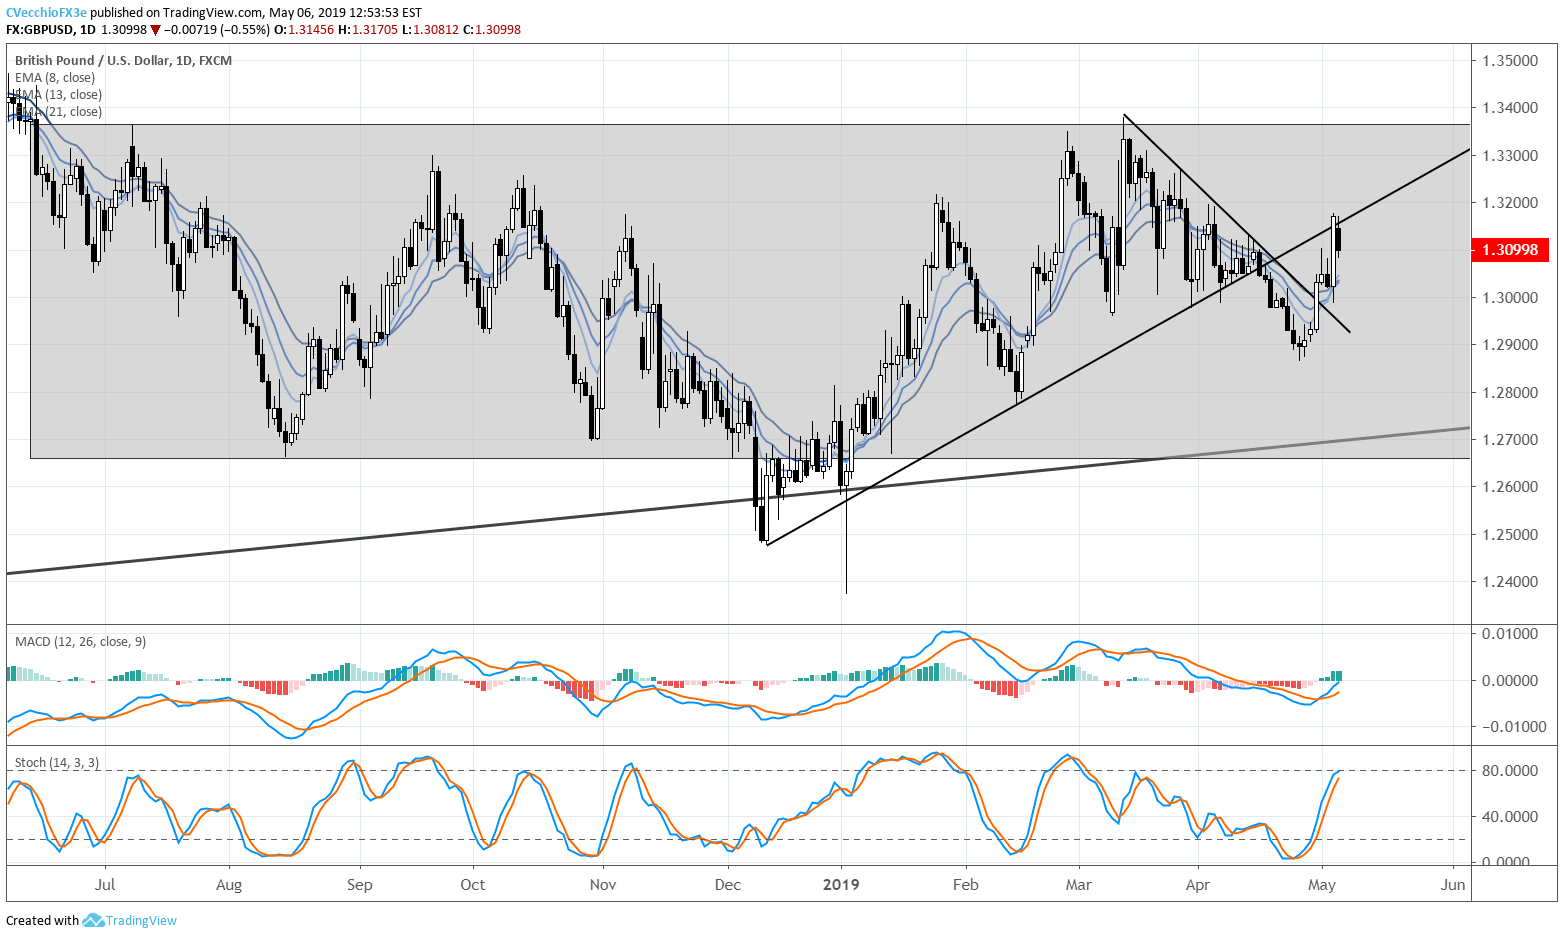
Since the bearish outside engulfing bar on June 14, 2018, GBPUSD has closed all but 14 days trading between 1.2660 and 1.3365 – approximately 94% of the past eleven-months within the range. GBPUSD prices have been quite choppy in recent days: price has broken the downtrend from the March and April swing highs, but price has been rejected at former uptrend support off the December 2018 low.
IG CLIENT SENTIMENT INDEX: GBPUSD PRICE FORECAST (MAY 6, 2019) (CHART 2)
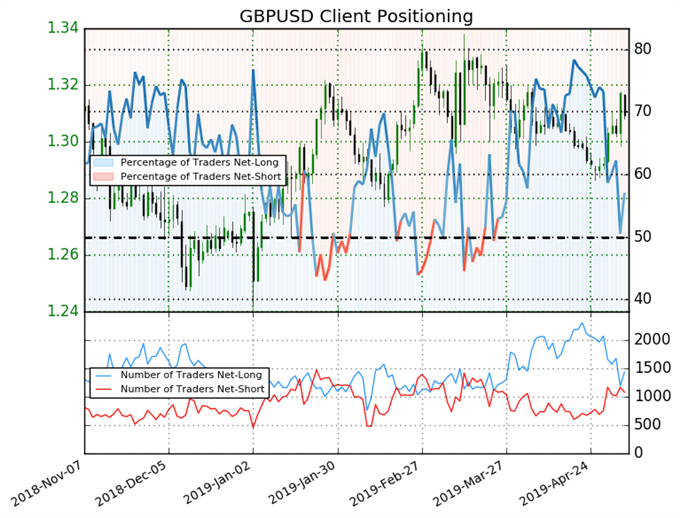
GBPUSD: Retail trader data shows 57.1% of traders are net-long with the ratio of traders long to short at 1.33 to 1. The number of traders net-long is 11.4% higher than yesterday and 31.6% lower from last week, while the number of traders net-short is 3.6% lower than yesterday and 38.5% higher from last week.
We typically take a contrarian view to crowd sentiment, and the fact traders are net-long suggests GBPUSD prices may continue to fall. Traders are further net-long than yesterday and last week, and the combination of current sentiment and recent changes gives us a stronger GBPUSD-bearish contrarian trading bias.


