The Importance Of Profitability In Australian Small Caps
It has long been evident that small-cap companies with a track record of generating earnings have outperformed relative to their peers. Profitability matters for small-cap companies, and the S&P/ASX Small Ordinaries Select Index was launched in 2018 to provide a measurement of these companies in Australia.
The S&P/ASX Small Ordinaires Select Index—which includes a profitably screen on constituent selection—turns five this December. This is a timely moment to reflect on the index’s performance versus its benchmark, the S&P/ASX Small Ordinaries.
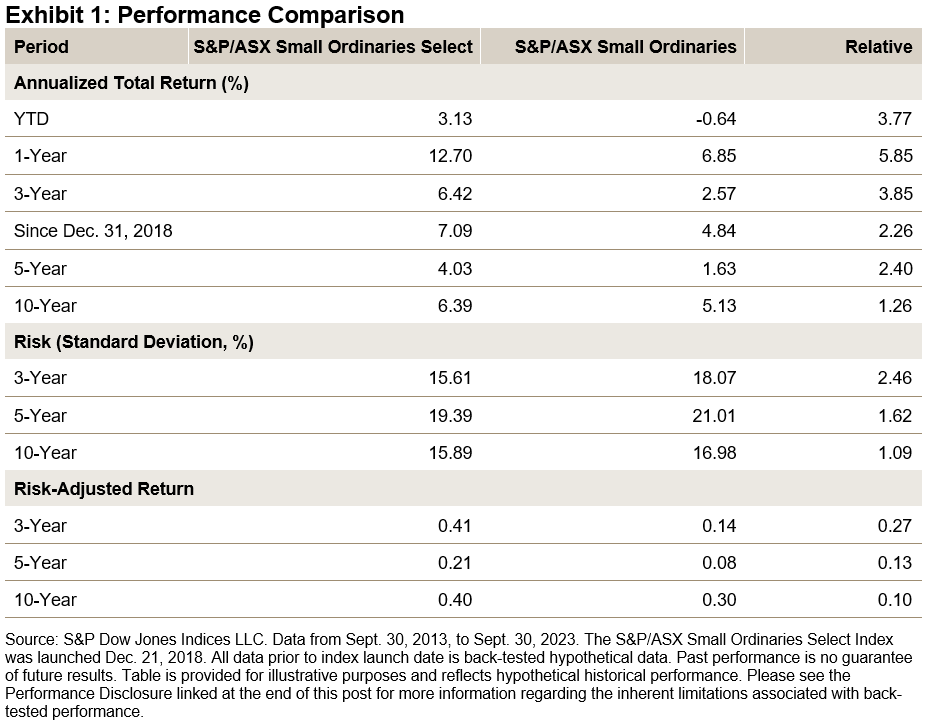
As of Sept. 30, 2023, the “select” approach has outperformed the S&P/ASX Small Ordinaries over all time periods studied, as well as demonstrating lower risk and, in turn, better risk-adjusted returns (see Exhibit 1). Notably, the past 12 months have been fruitful for the select approach, with the S&P/ASX Small Ordinaries Select Index outperforming the broader S&P/ASX Small Ordinaries by 5.85%.
(Click on image to enlarge)

When looking at rolling three- and five-year periods, the S&P/ASX Small Ordinaries Select Index outperformed the S&P/ASX Small Ordinaries over 70% of the time.
(Click on image to enlarge)

Positive EPS Approach Creates a Distinctive Small-Cap Index
Companies must have a track record of generating positive earnings to be eligible for inclusion in the S&P/ASX Small Ordinaries Select Index. The methodology requires constituents of the benchmark S&P/ASX Small Ordinaries to have a positive earnings per share (EPS) over the previous 24 months (two 12-month EPS periods) to be eligible for inclusion in the S&P/ASX Small Ordinaries Select Index. For existing constituents, over the prior 24 months, one of the previous two 12-month EPS periods must be positive for continued inclusion. The S&P/ASX Small Ordinaries universe includes companies outside the S&P/ASX 100 but within the S&P/ASX 300. This results in an index comprising 200 companies that represent the smaller end of the market. Currently, the S&P/ASX Small Ordinaries Select Index includes 142 of these companies that meet the profitability criteria.
While sector weights change over time, the “select” index had higher weights in the Real Estate, Financials and Industrials sectors and lower weights in Energy, Health Care and Information Technology as of Sept. 30, 2023 (see Exhibit 3).
(Click on image to enlarge)

Active Managers May Find the Select Approach Harder to Outperform
The recently released SPIVA Australia Mid-Year 2023 Scorecard showed the majority (55%) of Australian equity mutual funds underperformed the S&P/ASX 200 over the one-year period ending June 30, 2023. This figure increases to 81% and 79% over the 5- and 10-year periods, respectively. However, the scorecard shows that mid- and small-cap funds have historically fared better versus their benchmark. Yet, if we were to compare small-cap active funds to the S&P/ASX Small Ordinaries Select Index, small-cap managers would find it to be a more difficult benchmark to outperform, particularly over the past 12 months when profitability has led to above average relative outperformance.
Individual Company Contribution Drove Outperformance over the Past Year
Despite being underweight relative to the S&P/ASX Small Ordinaries, the Materials sector led in terms of performance contribution in the S&P/ASX Small Ordinaries Select Index over the 12-month period ending Sept. 30, 2023. This implies that the individual Materials companies within the select index had a more meaningful contribution to return, while the less profitable Materials companies excluded from the select index detracted from the performance of the broader S&P/ASX Small Ordinaries. Meanwhile, the S&P/ASX Small Ordinaries Select Index’s higher relative weight in the Financials and Industrials sectors also led to a higher performance contribution from those sectors compared to the S&P/ASX Small Ordinaries.
(Click on image to enlarge)


Since its launch in 2018, the profitability approach applied by the S&P/ASX Small Ordinaries Select Index has led to it outperforming its underlying index, the S&P/ASX Small Ordinaries, and it has also resulted in an index that is more difficult for active managers to beat historically.
More By This Author:
Tracking The Sun With IndicesCan Active Managers Outsmart the S&P 500 Dividend Aristocrats?
Seeking Shelter In Short-Term Municipals
Disclaimer: See the full disclaimer for S&P Dow Jones Indices here.


