
The ETF Portfolio Strategist - Saturday, Jan. 2
Asia Ex-Japan Equities Led 2020 Returns
If you held a healthy share of equities across Asia -- excluding Japan -- in your investment strategy last year, congratulate yourself. This slice of global asset classes not only posted the strongest return this week, Asia ex-Japan also outperformed the rest of the field for our list of proxy ETFs representing the major asset classes on a global basis.
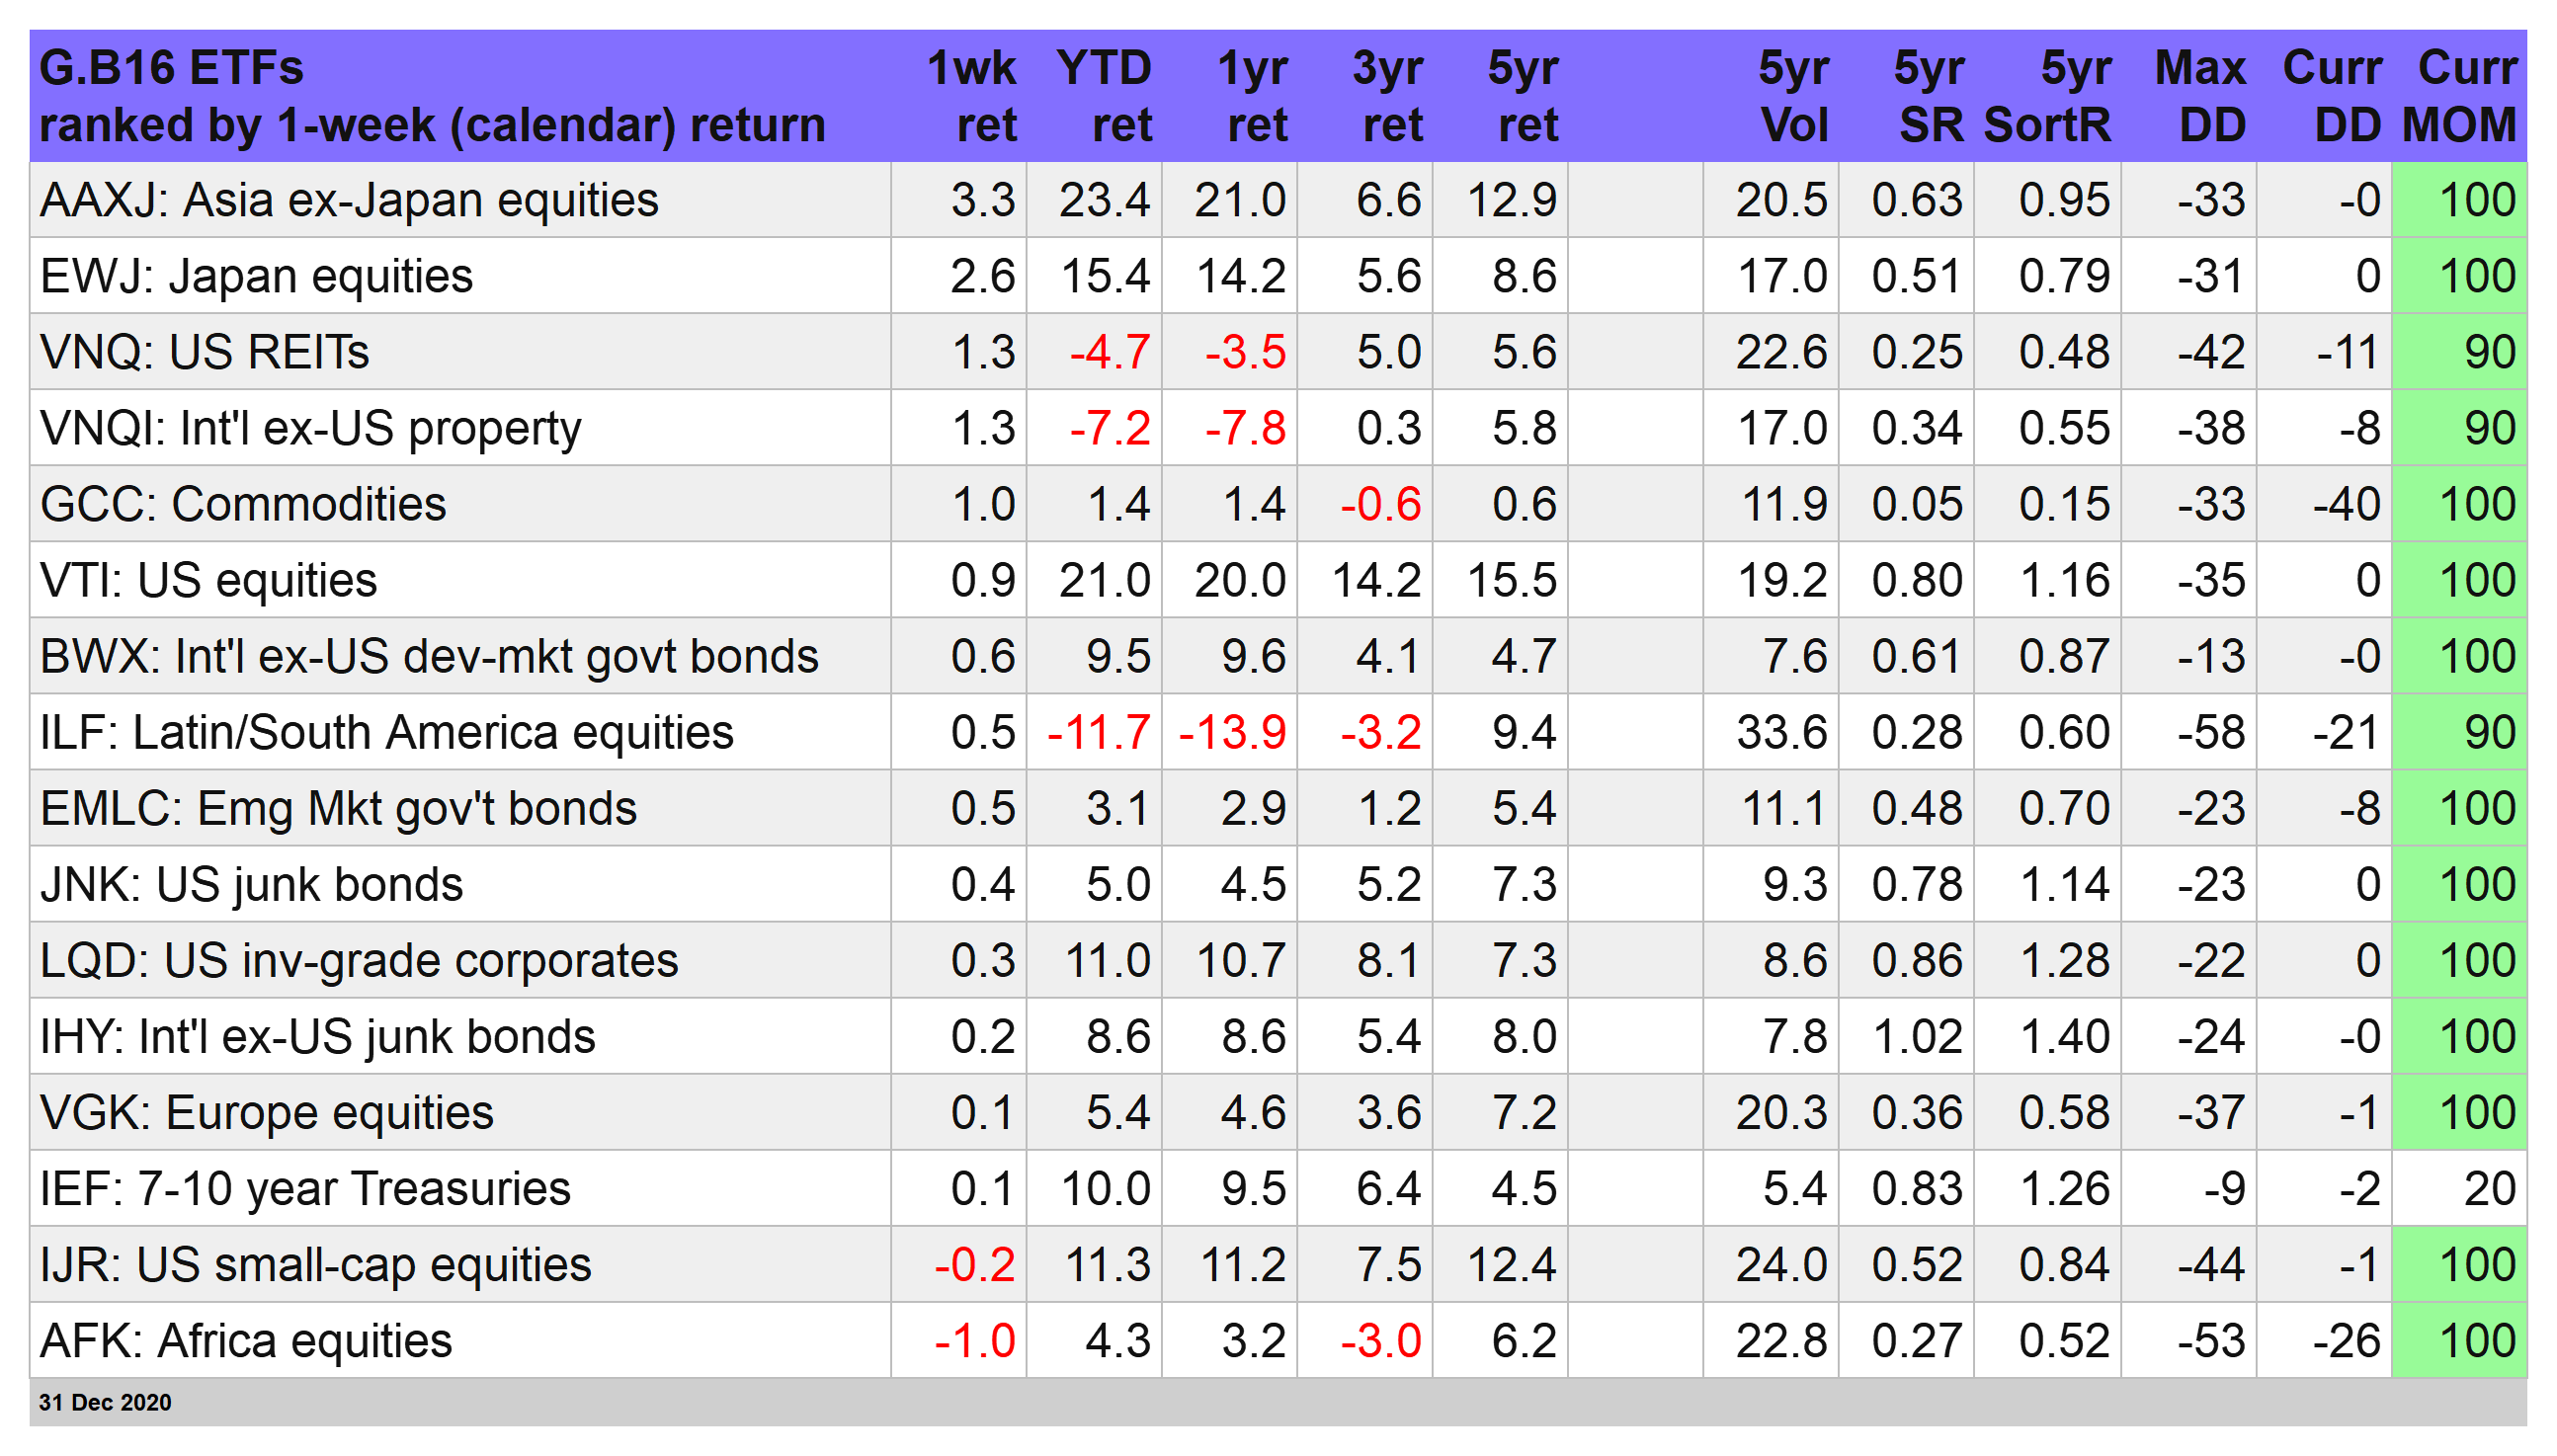
The iShares MSCI All Country Asia ex Japan ETF (AAXJ) closed on Dec. 31 with a strong 3.3% weekly gain (based on a shortened holiday trading week in the US). The increase translates to a 21.0% total return for 2020. On both fronts, AAXJ was the top performer.
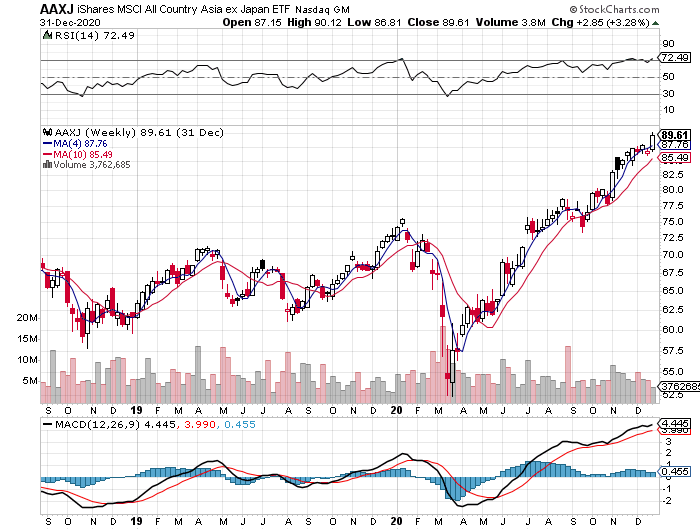
China shares are AAXJ’s biggest country allocation, comprising nearly 44% of the fund’s assets (as of Dec. 30), according to iShares. A key factor in the bull run: China’s economic recovery from the coronavirus – the strongest in the world among big economies.
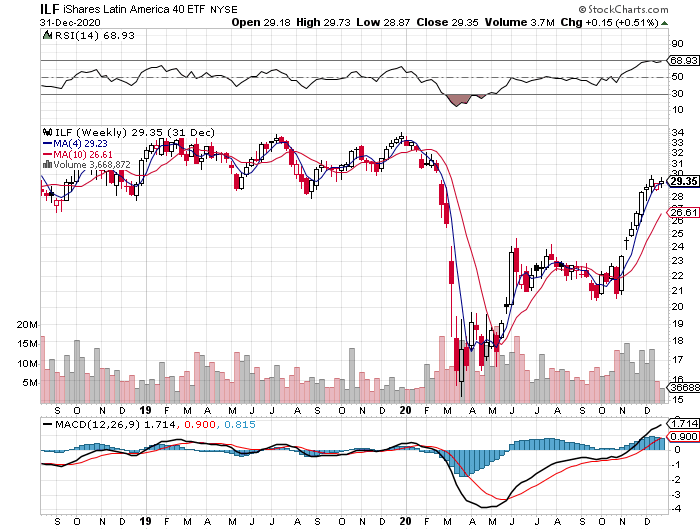
There were only a handful of losers in 2020 via the major asset classes. US and foreign real estate shares suffered a moderate degree of red ink last year. The only other 2020 decline on our proxy list for the major asset classes: stocks in Latin America. Although the iShares Latin America 40 ETF (ILF) rallied sharply in the fourth quarter, it wasn’t enough to offset losses from earlier in the year, leaving the fund down by nearly 14% in 2020.
A common denominator in 2020 for nearly every fund in the table above: strong upside trending behavior at last year’s close (as shown by the current MOM rating column in the table above).
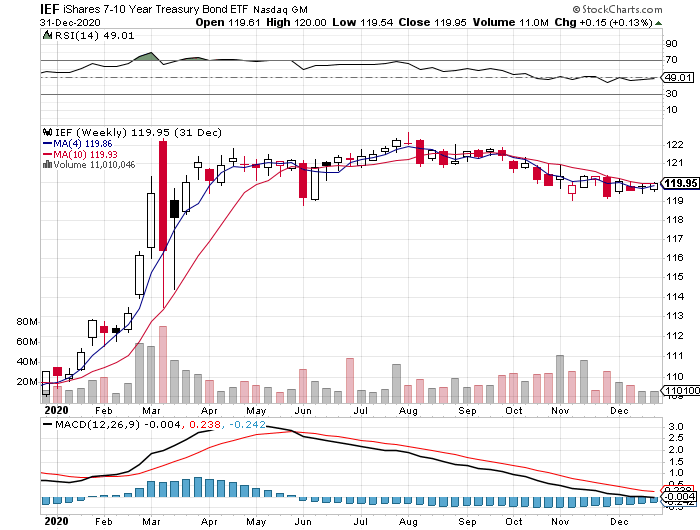
The glaring exception: US Treasuries, which continue to reflect a mild but persistent downside trend rating, based on iShares 7-10 Year Treasury Bond ETF (IEF). (For details on all the risk metrics as well as the strategies and benchmarks, see this summary.)
A Strong Run For Beta Risk In 2020
The popular US 60/40 stock/bond strategy mix (US.60.40) topped our standard menu of unmanaged portfolio benchmarks in 2020. This measure of US equities (VTI) and US bonds (BND) rebalanced to a 60%/40% weight, respectively, at the end of each calendar year, rising 15.1% over the past 12 months.
Adding a broader set of asset classes was a headwind last year, although only moderately so. Our second-best performer for our strategy benchmarks: Global Market Index, an unmanaged, unrebalanced portfolio that holds all the major asset classes (via ETF proxies) in market-value weights. GMI’s gain in 2020: 13.9%, which is only modestly behind US.60.40’s bull run for last year.
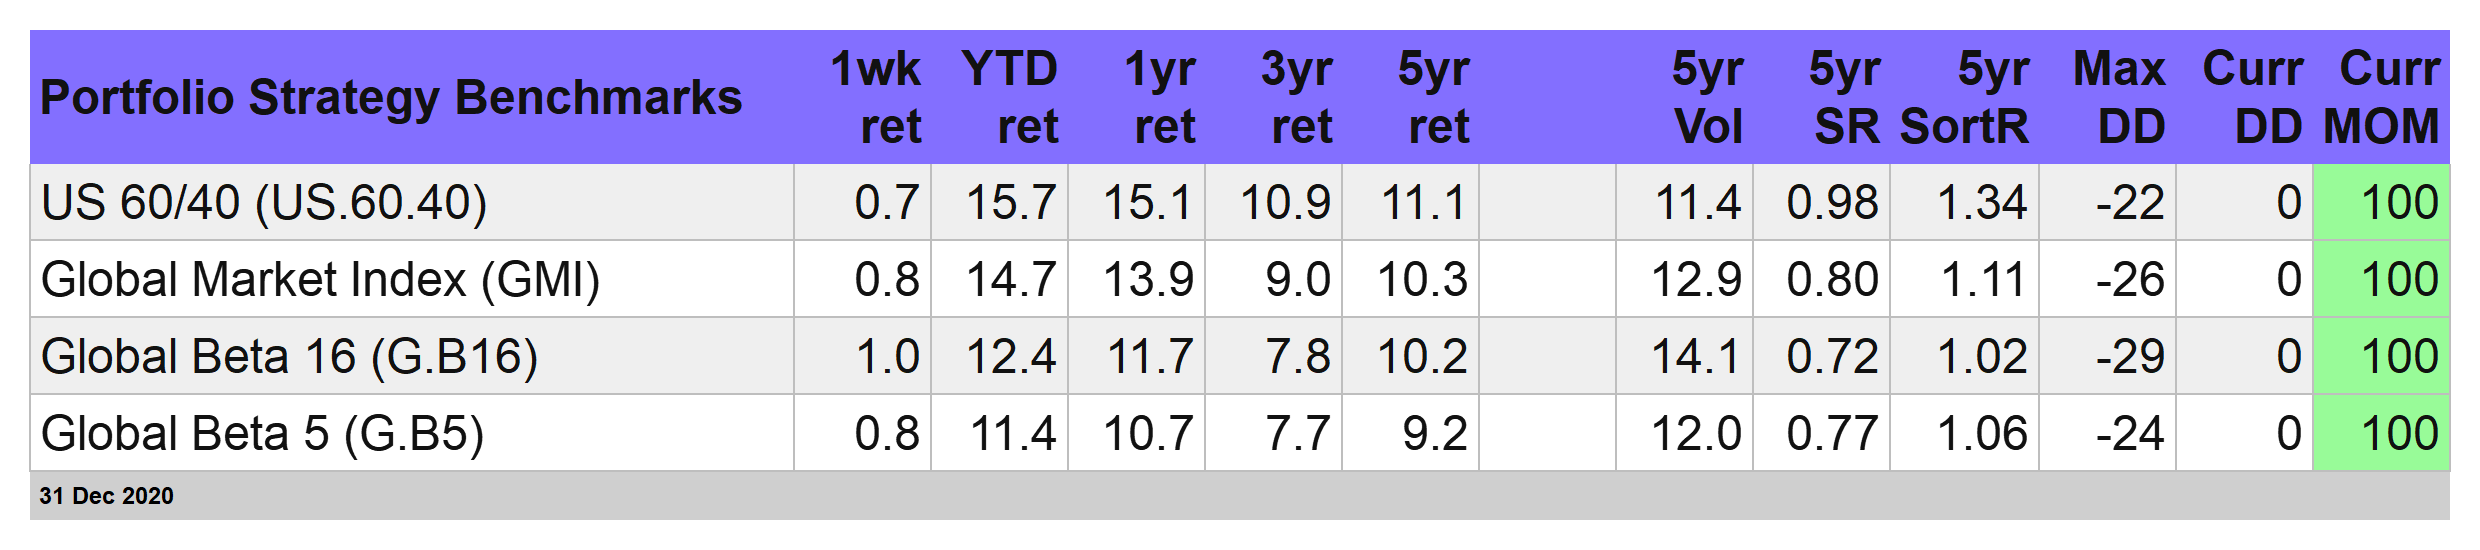
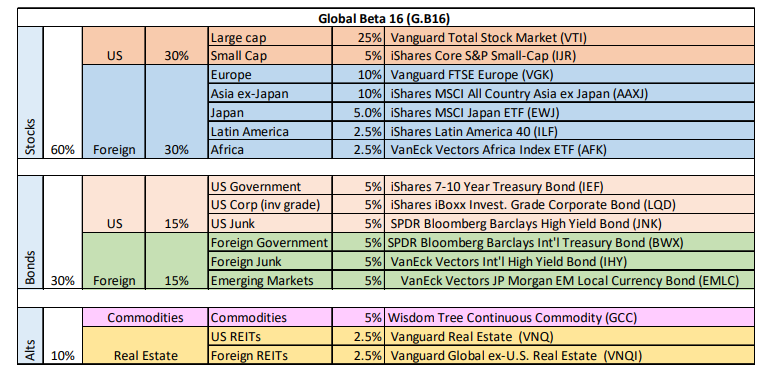
For context, note that the G.B16 strategy benchmark, which holds all 16 ETF proxies for the major asset classes (in weights shown below), was up 11.7% in 2020. That’s comfortably behind US.60.40 and GMI.
Managed Volatility Strategy Surged In 2020
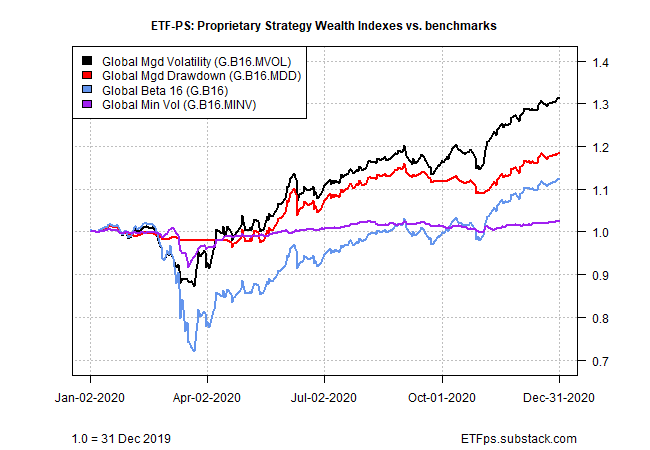
Thanks to risk-management signals that sidestepped the worst of the coronavirus crash last spring, Global Managed Volatility (G.B16.MVOL) posted an impressive 30.5% total return in 2020. As with all three of our proprietary strategies in the table below, G.B16.MVOL targets the 16-fund opportunity set in the table above.
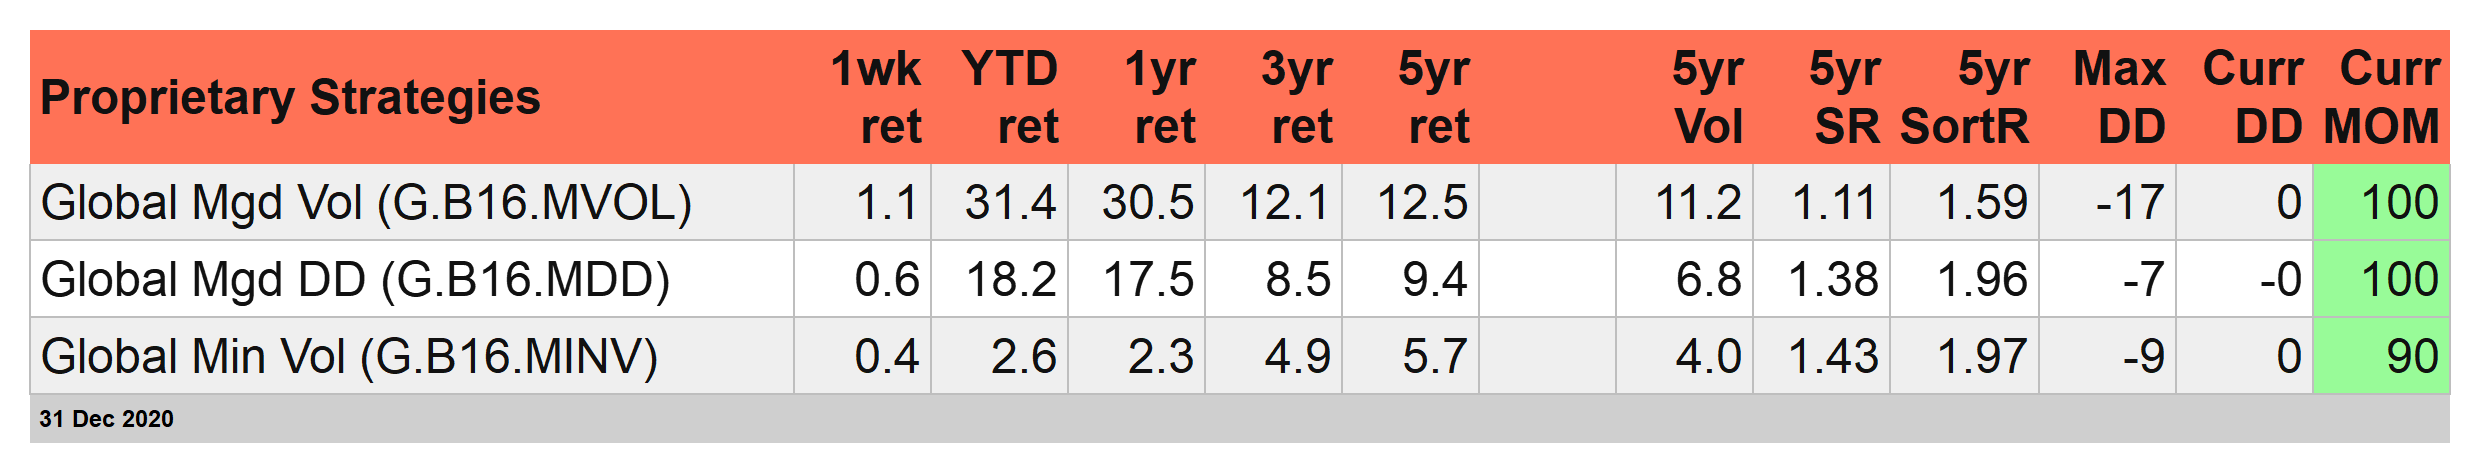
Note that G.B16.MVOL and its sister risk-management strategy – Global Managed Drawdown (G.B16.MDD) – are both in full-on risk-on mode, and I currently recommend holding all ETFs in the 16-fund opportunity set (per the first table posted above).
By contrast, putting a lid on volatility backfired in 2020, at least based on the version of a minimum volatility portfolio tracked on these pages. Global Minimum Volatility (G.B16.MINV), which targets the same ETF opportunity set as G.B16.MVOL and G.B16.MDD, posted a weak 2.3% gain last year.
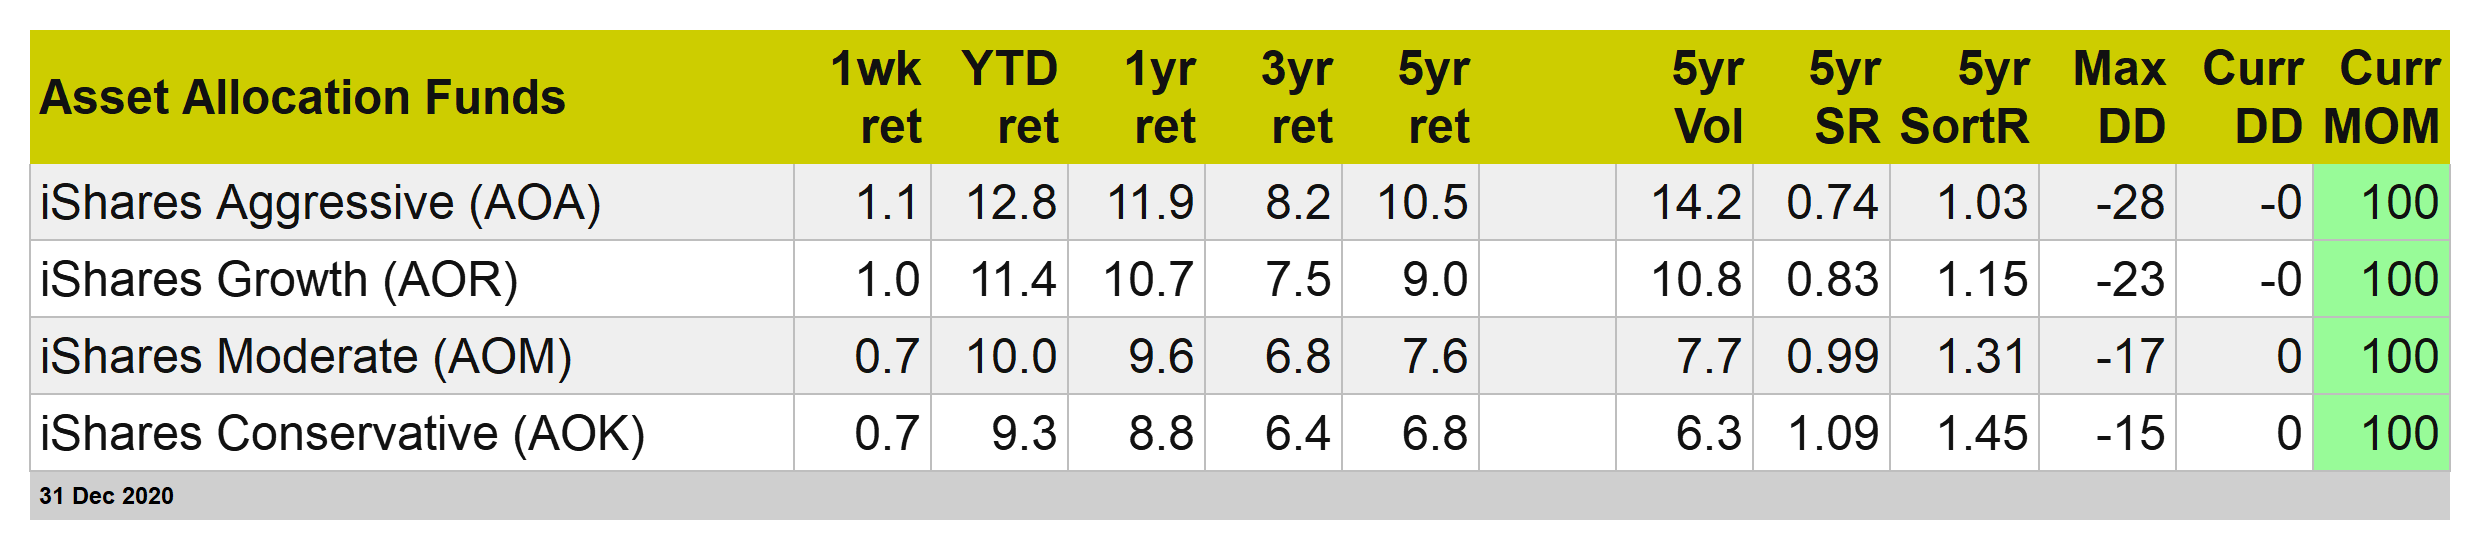
Let’s wrap up the 2020 review with a quick profile of BlackRock (BLK)’s four asset allocation ETFs, which target varying levels of risk. In all four cases, returns are solidly positive for the year, ranging from 8.8% for the conservative strategy (AOK) to 11.9% for the aggressive mix (AOA).
Optimism is high for the year ahead in terms of repairing more of the damage left in the wake of a global pandemic, courtesy of expectations via the ongoing rollout of vaccines. The question for investors in the year ahead: Is most of the optimism already priced into markets?
Yes, although the potential for continued economic recovery, which may extend well beyond 2021, could keep the party going. That’s our baseline outlook, but with a caveat: meaningful progress for putting the pandemic into the history books will likely be slower than markets seem to be anticipating.
As a result, the potential for market volatility on the downside, particularly in the first quarter, is probably higher than 2020’s year-end pricing party implies.
Disclosure: None.


