
Swiss Customs Data Indicates Gold Flowing East To West
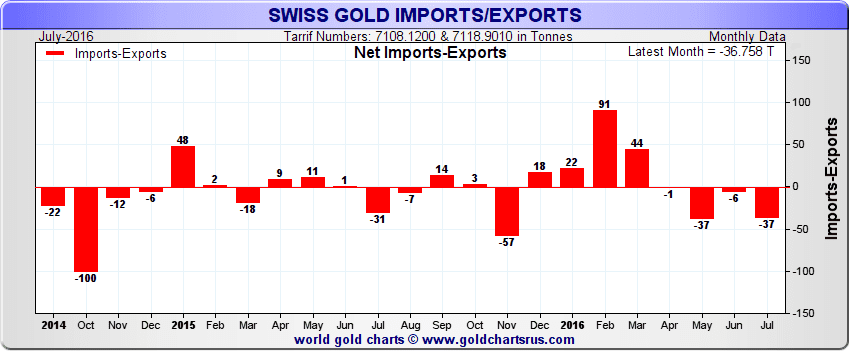
Switzerland has just released its gold import/export figures for July and the summary below from www.goldchartsrus.com shows another big month of net exports. Swiss gold flows are worth looking at because Switzerland is home to over 5000 tonnes of refinery capacity (see this BullionStar article for more detail) as well as being a major vaulting location. Their figures can therefore give some insight into regional demand and supply and investor sentiment.
In the chart below I’ve grouped flows in and out of Switzerland by key regions. The blue “other” is dominated by gold producing countries in Africa, South America and CIS and that, along with flows from Europe, are fairly consistent. This is to be expected as mines produce at a steady rate apart from those in more extreme environments where seasonal cycles are in play. The other sources of “input” metal for Swiss refineries are scrap and re-barring of existing stocks.
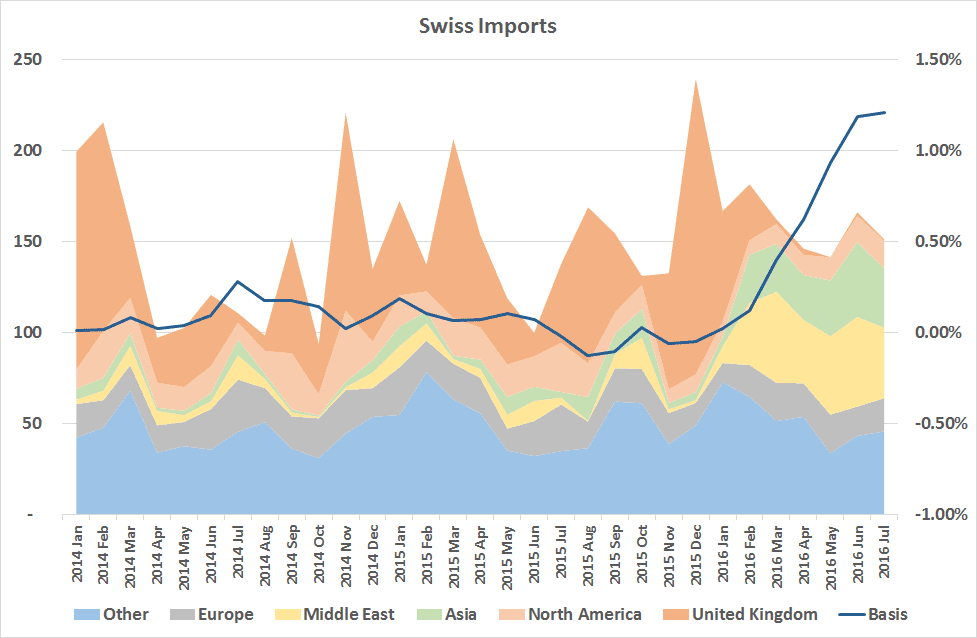
The light and dark orange represent the West and green and yellow the East. The flows from the East are usually scrap driven whereas the Western flows, certainly out of the UK, would be large bars being re-barred into kilobars for the Asian markets.
It is clear there was a shift early this year where we see flows out of Asia and the Middle East increase dramatically with a corresponding reduction in flows from the USA and UK. Higher metal prices often results in more scrap flows from Asia, so the increase in gold prices in 2016 has been a factor behind this change. In the case of the UAE, as they are a source location for both legitimate and smuggling trade to India, as Indian demand has waned and the market there has become oversupplied (indicated by prices there going to a discount to London, see this article quoting an importing bank saying that “so far in 2016 our bullion business is down nearly 75 percent”) any stock build up by Middle East dealers would have to be liquidated.
The blue line is the 3 month basis (a measure of profits to carry/hoard gold), which also started increasing at the same time (hat tip to Monetary Metals commenter rowing boat for noting this correlation), an indicator that speculative money flow into gold was higher than the money flow into physical (basis rising with a rising price).
When we look at Swiss Exports we see the East-West flow change confirmed, with a drop in the flows out to India and Asia and in their place gold being shipped to the UK and USA (ETF driven).
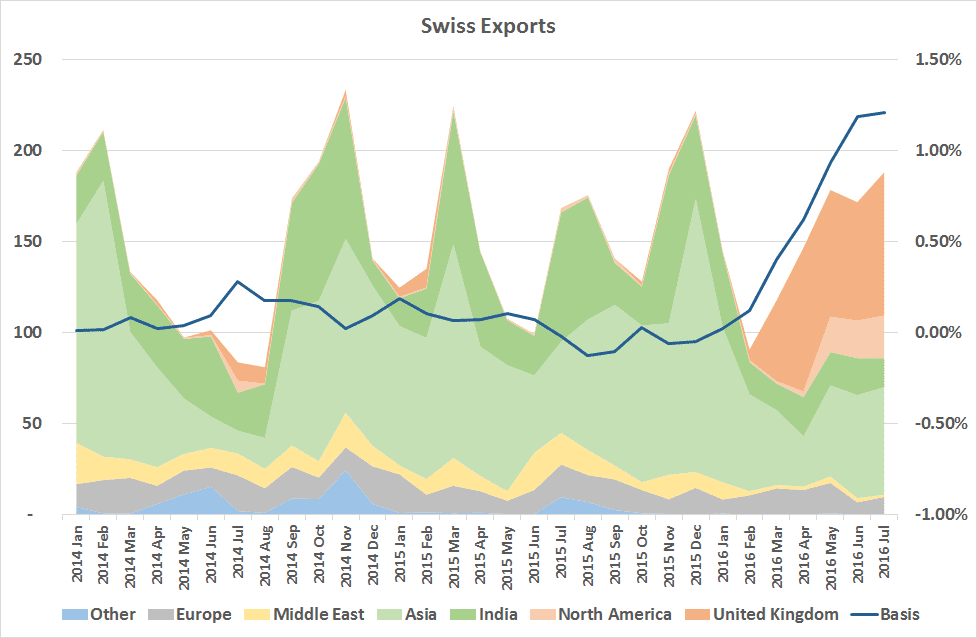
The gold basis figures in the chart are a monthly average, hiding the weakening that occured during July and into August. Monetary Metals’ analysis of market prices and spreads indicates that this fall in the basis was driven by continued spot buying (the flows to the West in the chart above, mostly into ETFs, being but one example) while speculative interest cooled. This sets the gold market on a more solid footing, part of a necessary consolidation period I discussed in this interview, before it can attempt another leg up.
Disclosure: None
Speculative versus fundamental demand is something Monetary Metals also aims to identify with our more


Thanks for sharing