

Image Source: Unsplash
Market conditions are currently poor. I’m not taking new swing trading long trades until conditions improve. I have no long positions and I am in cash. There will be no scan list this week since taking trades is probably at least a week away for me (or more - however long it takes for conditions to improve).
How the Market Indexes Are Doing
I look at 4 different US indices because they each tell a different story about overall stock market health. The stock market is healthiest—and swing trading stocks on the long side is most profitable—when all these indexes are in uptrends. Here’s what each of the 4 indices represents:
- Nasdaq 100 – Tech stocks.
- S&P 500 – Large US companies.
- NYSE Composite – A wide array of stocks, varying in size and industry.
- Russell 2000 – Smaller companies.
2 Canadian stock indices are also included. The Composite tracks larger companies, while the Venture tracks very small companies.

Charts are provided by TradingView – these are charts I personally use.
All the indices had a rough week. From a price action perspective, all the indices are in short-term downtrends amid a longer-term downtrend. Downtrends are composed of lower swing highs and lower swing lows, and that is what we have right now in the US and Canadian indices. Uptrend behavior defined by higher swing highs and higher swing lows. Until that happens, these indices are weak and represent what is happening in most stocks.
State of the Market Health Indicators
The following chart shows the market health indicators I track. They tell me the condition of the stock market overall, and whether it’s a good time to swing trade individual stocks.

The market health indicators are poor.
- 4% of S&P 500 stocks are above their respective 50-day moving averages. 12% of all US stocks are above their respective 50-day moving averages. It’s generally much easier to swing trade profitably (on the long side) when more stocks are above their 50-day averages. When this indicator is below 50%, it tends to signal sideways movement or a downtrend for most stocks/indexes. This is a poor indicator.
- Volume is not currently relevant.
- The dark blue bars are the daily percentage movement of the S&P 500. Big moves are associated with downtrends and turning points. Small values are associated with an uptrend. Values of -2 are a warning sign anytime they occur. A more than 3% drop was seen on Sept. 13. Nearly 2% drops were seen on Sept. 21 and Sept. 23. This is another poor indicator.
- The blue line is the cumulative NYSE Advance-Decline Line. It is trending lower. Any strength it was showing has been lost. This is a poor indicator.
- The blue columns are NYSE up volume divided by NYSE total volume. It tracks buying and selling enthusiasm. A 93% downside day was seen on Sept. 6. This is a poor indicator as well.
- The ultimate indicator is how many quality setups there are and how trades are working. Once the indicators turned negative in mid-September, nearly all the stocks that I was watching or trading started to break down. A few managed to hold up, but that doesn’t matter. If we are watching 10 stocks, we want 7 of them to be acting well. Right now, maybe 1 or 2 out of 10 are performing decently. And they aren’t even really moving up, they are just holding their ground. These are not favorable conditions to be trading in. Wait for pretty much everything you’re watching to be popping higher.
Sectors on the Move
Everything tumbled this past week. Utilities and defensive stocks performed the least badly, which still isn’t good.
Over the last month and three months, financials, industrials, and consumer cyclical stocks were the ones to occur in upper half on both time frames. I am more interested to see which sectors start emerging when the market health indicators improve. Those could be sectors that lead the next bull market.
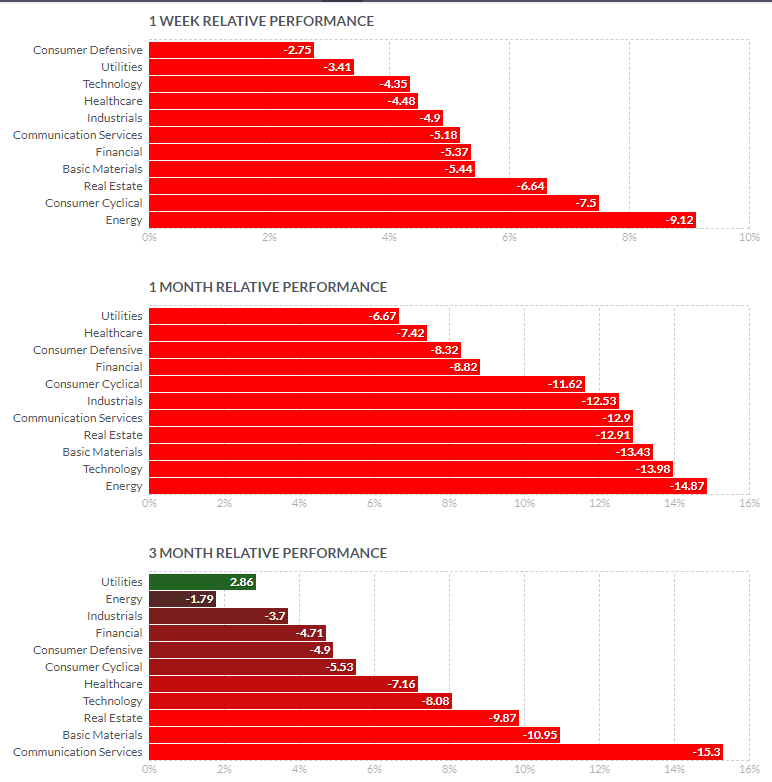
Sector performance provided by Finviz.
What I’m Doing Right Now
I’m not adding new long swing trading positions right now. I’ll wait for conditions to improve. As always, I am day trading - it has saved me and provided income while swing trading has been slow in 2022. I often day trade the EUR/USD currency pair as well.
More By This Author:
What Your Charts Aren’t Telling You And How It Affects Backtesting And Strategy PerformanceSwing Trading Stock Market Outlook For The Week Of Sept. 19
Swing Trading Stock Market Outlook For The Week Of Sept. 12


Comments
Log in or sign up to join the conversation.