
Stock Market Health Update For The Week Of June 13

Image Source: Pexels
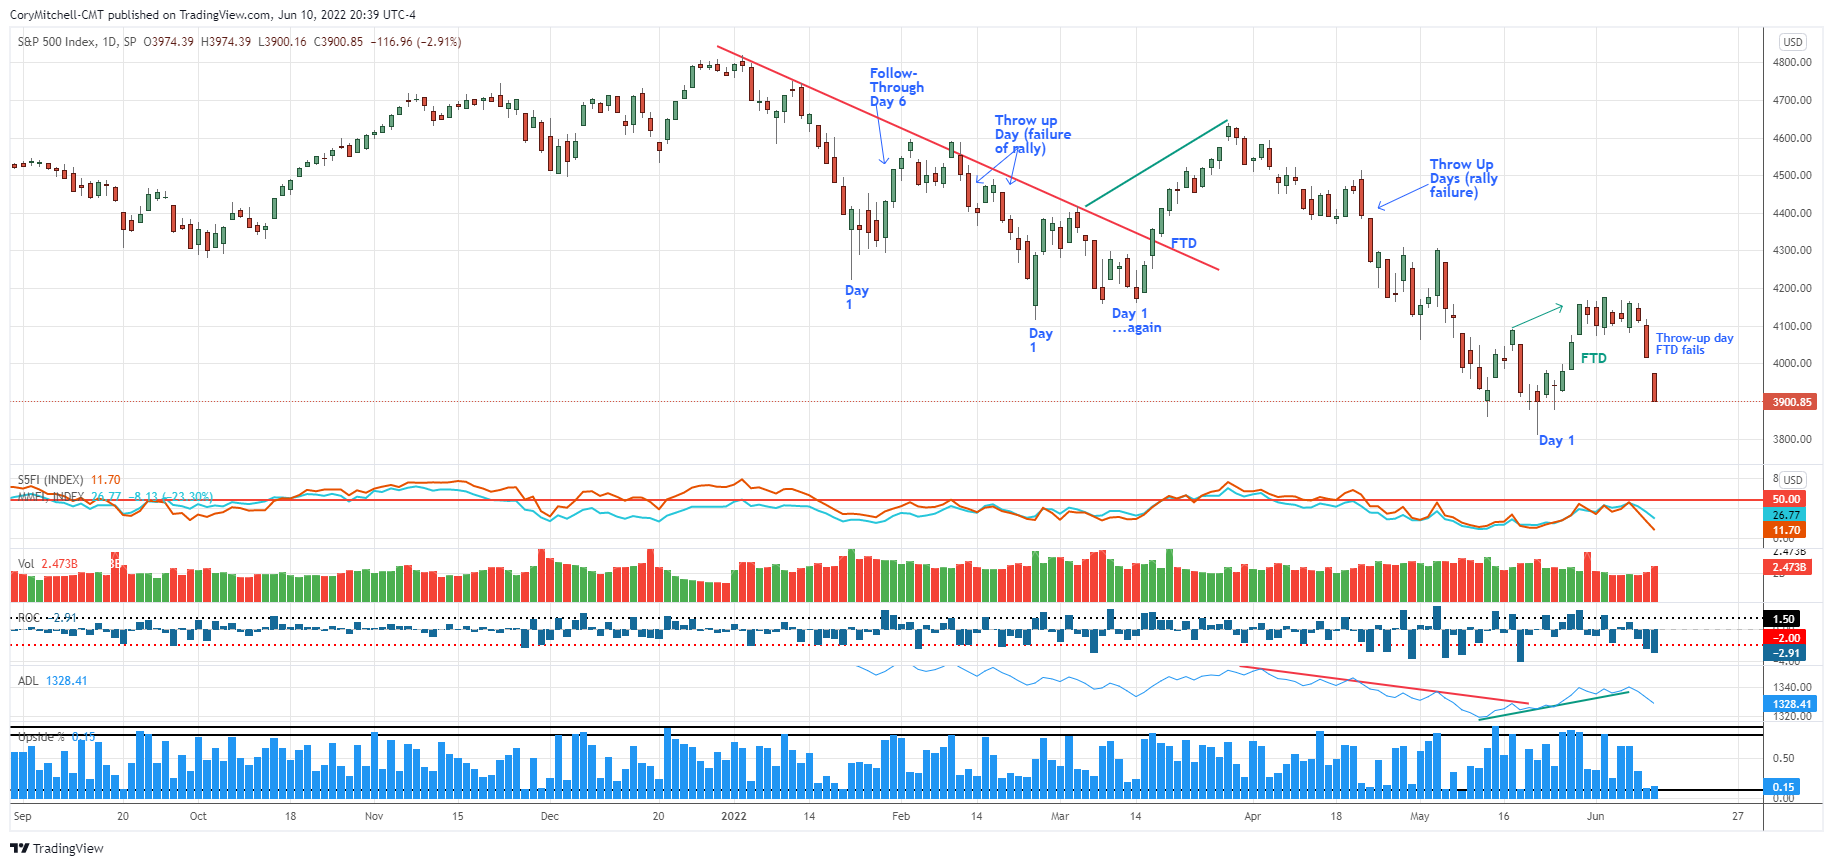
A 'throw-up day' is when a 'follow-through day' fails or is counteracted by an extremely bearish day, usually at the point when the market should move higher if the follow-through is to work. It’s called a 'throw-up day' because the trapped bullish traders are sick to their stomachs due to the hard drop.
A follow-through day occurred in the S&P 500 on May 26. A couple of days after that the market flat-lined and was sideways from May 31 to June 8. June 9 was a throw-up day for a couple of reasons:
- The rise in late May in the S&P 500 was followed by a sideways period. If this were an emerging uptrend, I would expect the price to break aggressively higher from the sideways period, not aggressively lower.
- June 9 was a greater than 2% drop. Single-day drops of that magnitude are associated with bear markets, not rising markets. It more than offset the single-day rise of the follow-through day.
Long story short, last weekend I was looking forward to the possibility of taking some trades if the indices continued to show strength. That situation didn’t materialize. I remain in cash due to poor market health, as discussed below.
I am willing to take the odd oil-related stock trade because those stocks are performing well at the moment, but for the most part, I am keeping my swing trading capital away from the long side in stocks at the moment.
How the Market Indexes Are Doing
I look at 4 different US indices because they each tell a different story about overall stock market health. The stock market is healthiest, and swing trading stocks on the long side is most profitable, when all these indexes are in uptrends. Here’s what each of the 4 indices represents:
- Nasdaq 100 – Tech stocks.
- S&P 500 – Large US companies.
- NYSE Composite – A wide array of stocks, varying in size and industry.
- Russell 2000 – Smaller companies.
2 Canadian stock indices are also included. The Composite tracks larger companies, while the Venture tracks very small companies.

Charts are provided by TradingView – these are charts I personally use.
All the indices had a rough couple of days recently. The short-term uptrends that had developed since mid-May are in danger of being broken. The longer-term trend remains down.
Pullbacks often present great swing trading buying opportunities when stocks/indices are in uptrends. During an overall downtrend, a drop after a brief rally is simply a signal to remain cautious. Context matters.
State of the Market Health Indicators
The following chart shows the market health indicators I track. They tell me the condition of the stock market overall, and whether it’s a good time to swing trade individual stocks.
The market health indicators were trying to improve, but they turned poorly over the last few days.
- 12% of S&P 500 stocks are above their respective 50-day moving averages. 27% of all US stocks are above their respective 50-day moving averages. It’s generally much easier to swing trade profitably (on the long side) when more stocks are above their 50-day averages. When this indicator is below 50%, it tends to be sideways or a downtrend for most stocks/indexes.
- Volume is not important at this exact moment, although we can see volume has escalated recently on the last two days of selling.
- The dark blue bars are the daily percentage movement of the S&P 500. Big moves are associated with downtrends and turning points. Small values are associated with an uptrend. Values of -2 are a warning sign anytime they occur. June 9 and 10 were both greater than -2% drops.
- The blue line is the cumulative NYSE Advance-Decline Line. It was showing a positive divergence recently, which was a good thing, but it recently has moved down sharply. Right now it is in line with what the index shows.
- The columns of blue are NYSE up volume divided by NYSE total volume. It tracks buying and selling enthusiasm. Levels below 10% and above 90% are important (or back-to-back days above 80%). On May 13, there was a 90% upside. These often occur within a week or so of a bottom. This was followed by three 80%+ days in a row on May 25-27. That’s good, but recent selloff days with heavy downside volume (little upside volume) show that this is still a dangerous market.
- The ultimate indicator is how many quality setups there are and how trades are working. Oil-related stock trades are still working well. I have identified and watched several quality breakouts in this sector. If I am going to trade, this is pretty much the only industry I am trading in.
My entire method of swing trading stocks is covered in the Complete Method Stock Swing Trading Course. Now is a great time to review the material and get ready for the next opportunities which are coming our way. Markets always turn around, and when they do, you want to be armed with ways to profit from it.
What I’m Doing Right Now
I am mostly sitting on the sidelines. I will monitor oil stocks for the odd trade, but I’m not deploying a lot of capital. Even though oil is working right now, nothing holds up against a bear market for long.
If the stock indices remain weak, the rising oil stocks are on borrowed time (based on historical precedent when this has happened). There will be signs when those oil trades are losing steam too: mainly, the breakouts stop working.
I’m also day trading the EUR/USD pair. There is a lot of movement and potential with this pair, and I trade it every morning. Day trading stocks has also been good. There has been a lot of movement there as well, while swing trading has been slower.
Disclaimer: Nothing in this article is personal investment advice, or advice to buy or sell anything. Trading is risky and can result in substantial losses, even more than deposited if using ...
more
Comments
 No Thumbs up yet!

