
Sterling Price Outlook: British Pound Rally Stalls– GBP/USD Levels
The British Pound has rallied more than 3.4% against the US Dollar from the monthly lows with the advance taking Sterling into initial resistance targets. While the broader technical outlook remains constructive, the recent rally may be vulnerable near-term as price stalls here near fresh monthly highs. These are the updated targets and invalidation levels that matter on the GBP/USD charts.
STERLING PRICE CHART – GBP/USD DAILY
(Click on image to enlarge)
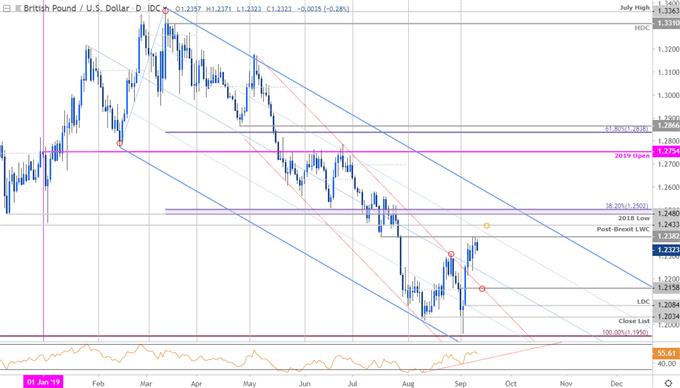
Chart Prepared by Michael Boutros, Technical Strategist; GBP/USD on Tradingview
Technical Outlook: In my most recent Sterling Weekly Price Outlook we noted that GBP/USD had, “turned from downtrend resistance this week at the median-line and we’re looking for support into the September open.” Cable registered a low at 1.1959 early in the month before reversing sharply higher with price now testing resistance at the mid-July swing low at 1.2382.
Monthly open support rests at 1.2158 with broader bullish invalidation set to the low-day close at 1.2084. A topside breach eyes subsequent resistance objectives at the post-Brexit low-week close at 1.2433 backed by key resistance at 38.2% retracement/ 2018 low at1.2480-1.25- look for a bigger reaction there IF reached.
STERLING PRICE CHART – GBP/USD 120MIN
(Click on image to enlarge)
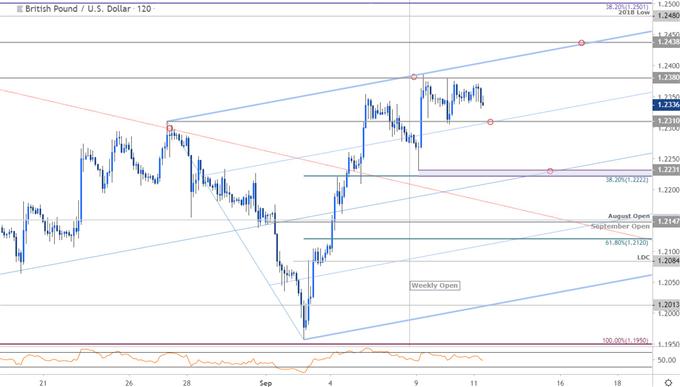
Chart Prepared by Michael Boutros, Technical Strategist; GBP/USD on Tradingview
Notes: A closer look at Sterling price action sees GBP/USD trading within the confines of an ascending pitchfork formation extending off the August / September lows with Cable testing the upper parallel on an outside-day reversal early in the week. Sterling has been in consolidation since Monday with the broader long bias at risk while below this slope.
Initial support rests at 1.2310 backed by the weekly opening-range lows / 38.2% retracement at 1.2222/31 – an area of interest for possible exhaustion IF reached. A break/close below this threshold would suggest a deeper correction is underway with such a scenario exposing the September / August open at 1.2147/51.
Bottom line: The British Pound is holding just below uptrend resistance and while our broader focus is higher, the advance may be vulnerable near-term while below this trendline. From a trading standpoint, we’ll favor fading weakness while within this formation, ultimately targeting a stretch towards 1.25.
STERLING TRADER SENTIMENT – GBP/USD PRICE CHART
(Click on image to enlarge)
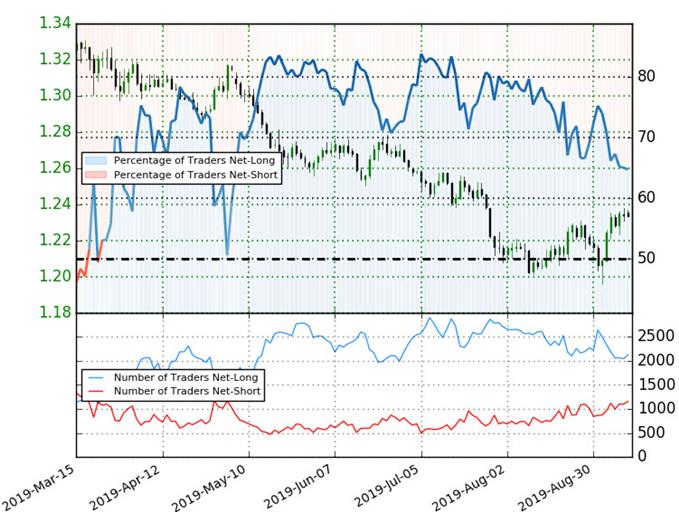
- A summary of IG Client Sentiment shows traders are net-long GBP/USD - the ratio stands at +1.83 (64.7% of traders are long) – bearish reading
- Traders have remained net-long since May 6th; price has moved 5.4% lower since then
- Long positions are 3.6% higher than yesterday and 20.2% lower from last week
- Short positions are0.4% higher than yesterday and 32.3% higher from last week
- We typically take a contrarian view to crowd sentiment, and the fact traders are net-long suggests GBP/USD prices may continue to fall. Traders are further net-long than yesterday & last week, and the combination of current positioning and recent changes gives us a stronger GBP/USD-bearish contrarian trading bias from a sentiment standpoint.


