
Stellantis Automotive Group Acquires First Investors Financial Service Group
For many investors, it is possible that the name Stellantis (STLA) may not mean anything to them. However, when we add the fact that Stellantis owns brands such as Peugeot, Citroën, Opel, Fiat, and Jeep, everybody will quickly realize that we are talking about an automotive giant.

Specifically, Stellantis is the result of a merger between the former PSA and FCA (Fiat Chrysler Automobiles) groups, which started last year and was finalized earlier this year, with the group's headquarters established in the Netherlands. As a result of this merger, the two groups expected to realize synergies of more than 3.7 billion euros, without needing to close any production plants.
Following the merger, the group comprises the following 14 brands:
| FCA Italy | FCA US | PSA Group |
|---|---|---|
| Fiat | Chrysler | Peugeot |
| Abarth | Dodge | Citroën |
| Alfa Romeo | Jeep | DS Automobiles |
| Lancia | Ram Trucks | Opel |
| Maserati | Vauxhall |
Source: Wikipedia
Today, Stellantis has announced the purchase of First Investors Financial Service Group for an amount close to 285 million US dollars.
First Investors Financial Service Group is a company that specializes in the financing of car sales in the United States. With this purchase, the group seeks to branch into this important market – hoping to bring with it increased revenue and profits, as well as the possibility of building customer loyalty.
Looking at the Stellantis share price, we can see that this year, Stellantis has followed an upward trend that led it to increase 37.22% by the end of August. However, the price is currently in a correction after setting annual highs on 13 August of around 22 dollars per share.
At the moment, the price is fighting to maintain the support represented by the 50% Fibonacci retracement level of the last upward movement. Although, after the bearish crossover of its short and medium-term moving averages, it is possible that this correction will seek its next support level in the area coinciding with its 200-period moving average in red and the 61.8% Fibonacci retracement level.
The loss of this level would open the door to a further correction in search of the uptrend line and the important support/resistance level of the orange band. However, as long as we maintain these levels the sentiment will remain positive.
(Click on image to enlarge)
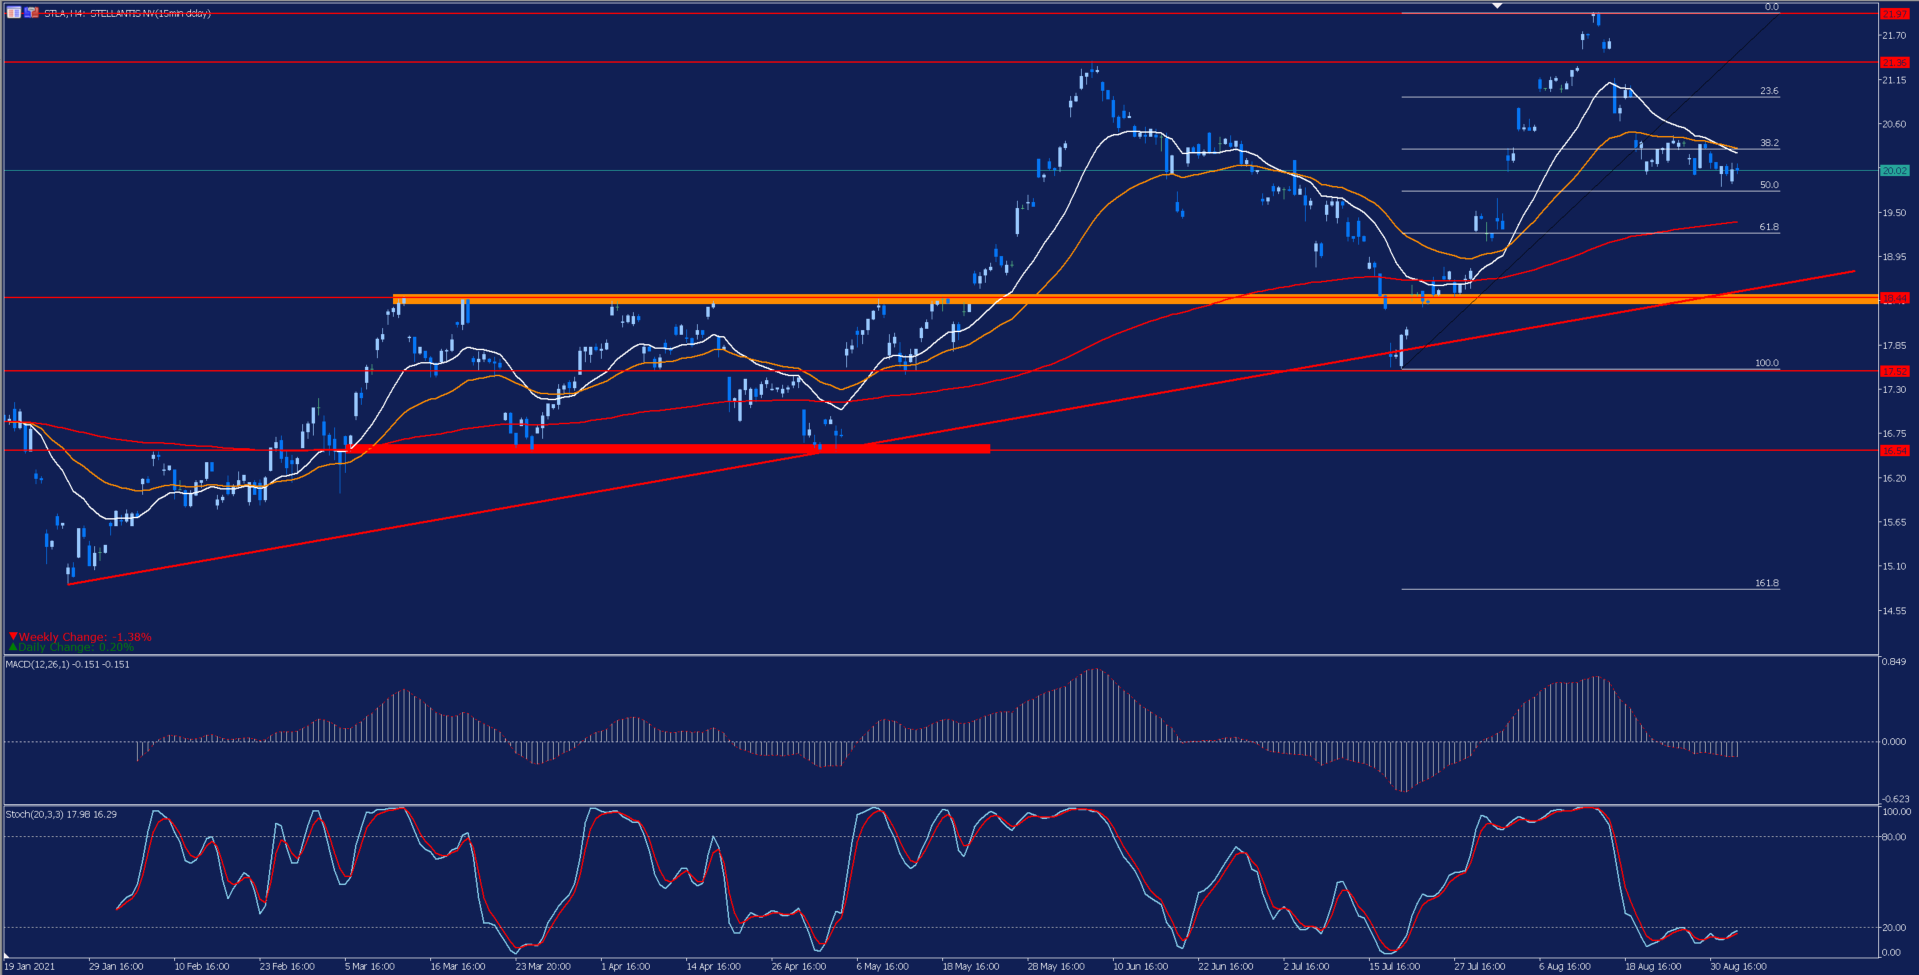
Depicted: Admirals MetaTrader 5 – Stellantis NV H4 Chart. Date Range: 18 January 2021 – 2 September 2021. Date Captured: 2 September 2021. Past performance is not a reliable indicator of future results.
Evolution of the last five years:
- 2020: 23.12%
- 2019: 12.52%
- 2018: -18.94%
- 2017: 96.52%
- 2016: -0.15%
Disclaimer: The given data provides additional information regarding all analysis, estimates, prognosis, forecasts or other similar assessments or information (hereinafter ...
more

