
SPX, Gold, Oil And G6 Targets For The Week Of October 1st
A lot has been said and written already about how great a quarter this was for the major indices. Looking back at 100 years of DJIA history, there have been 50+ quarters with similar or better performance, and the next quarter finished lower only 25% of the time. In addition, negative follow-up quarters were usually associated with periods when the DJIA was in a downtrend already.
The monthly SPX candle printed a doji, synonymous with indecision. However, the majority of the monthly dojis in the past have resolved to the upside.
Looking at the daily chart, the SPX is on track to reach our yearly upside target:
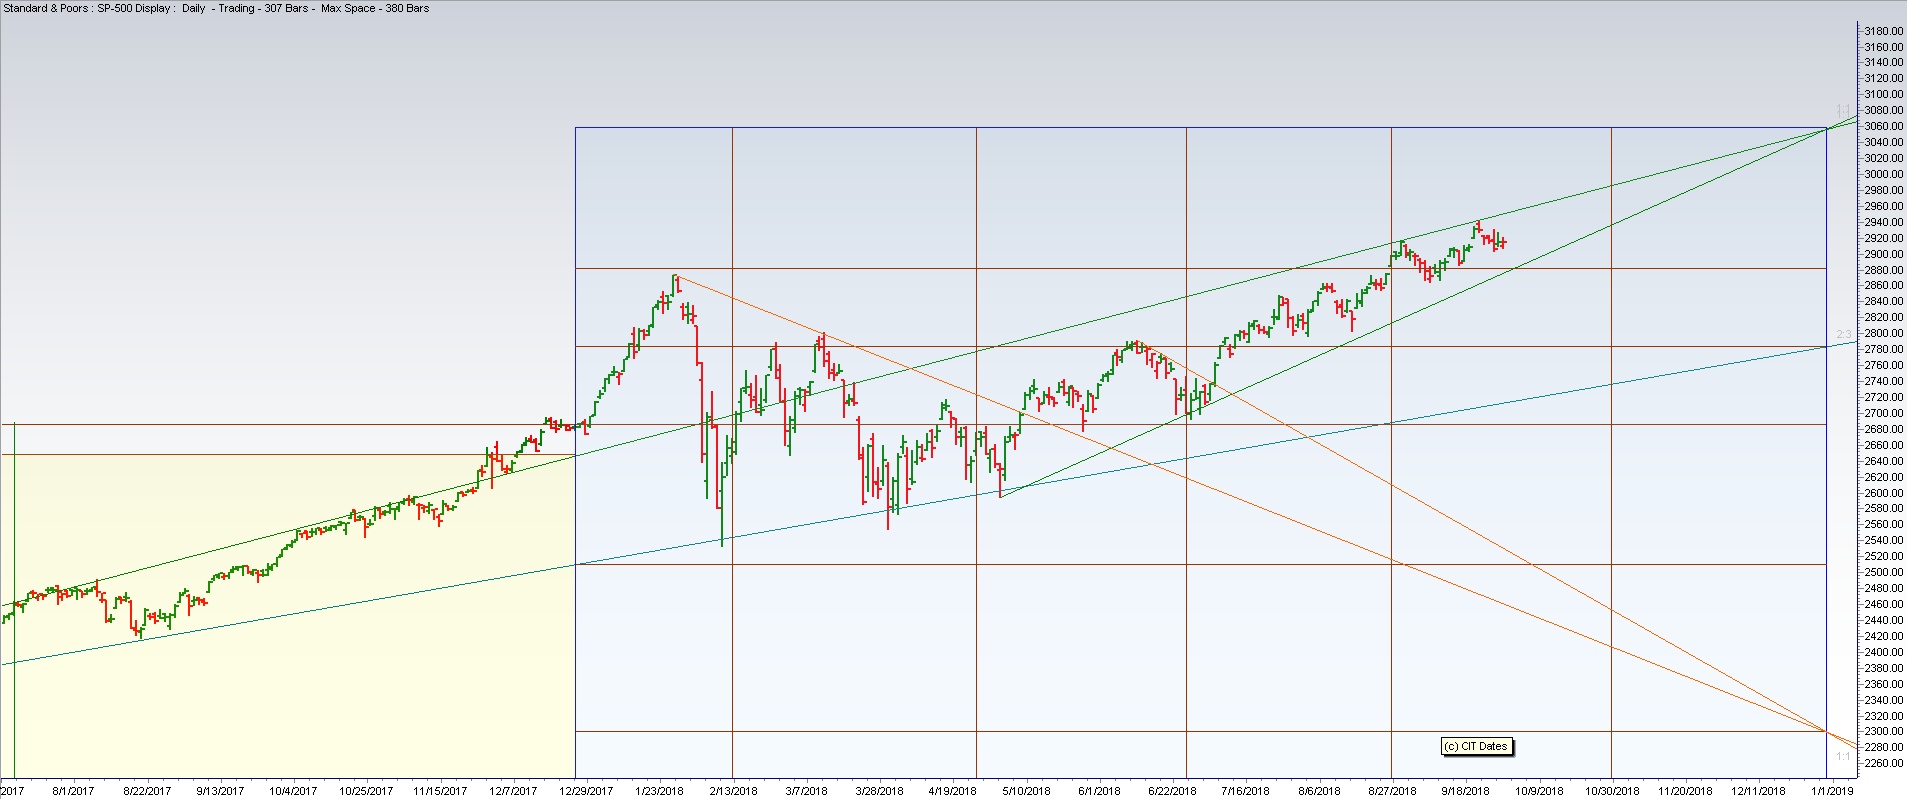
The key levels to watch for a bearish reversal are a break below the bullish target angle and 2880.
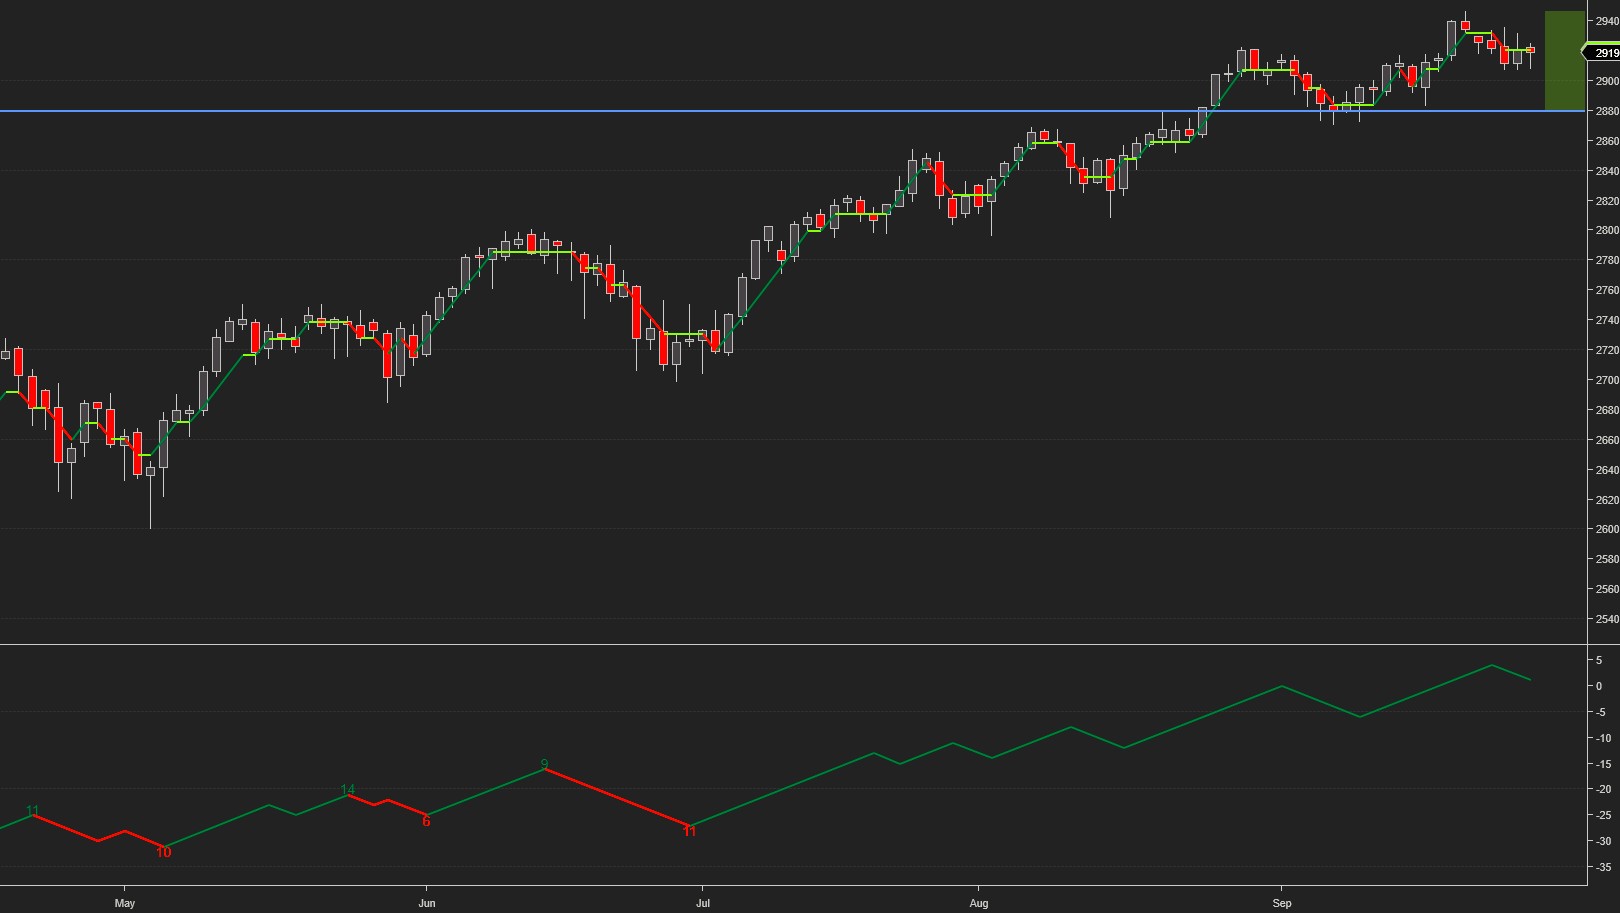
The projected trading range for next week for SPX is 2880-2950. Despite the usual pull-backs the daily uptrend, as evidenced by the CIT Wave indicator (bottom panel), remains intact:
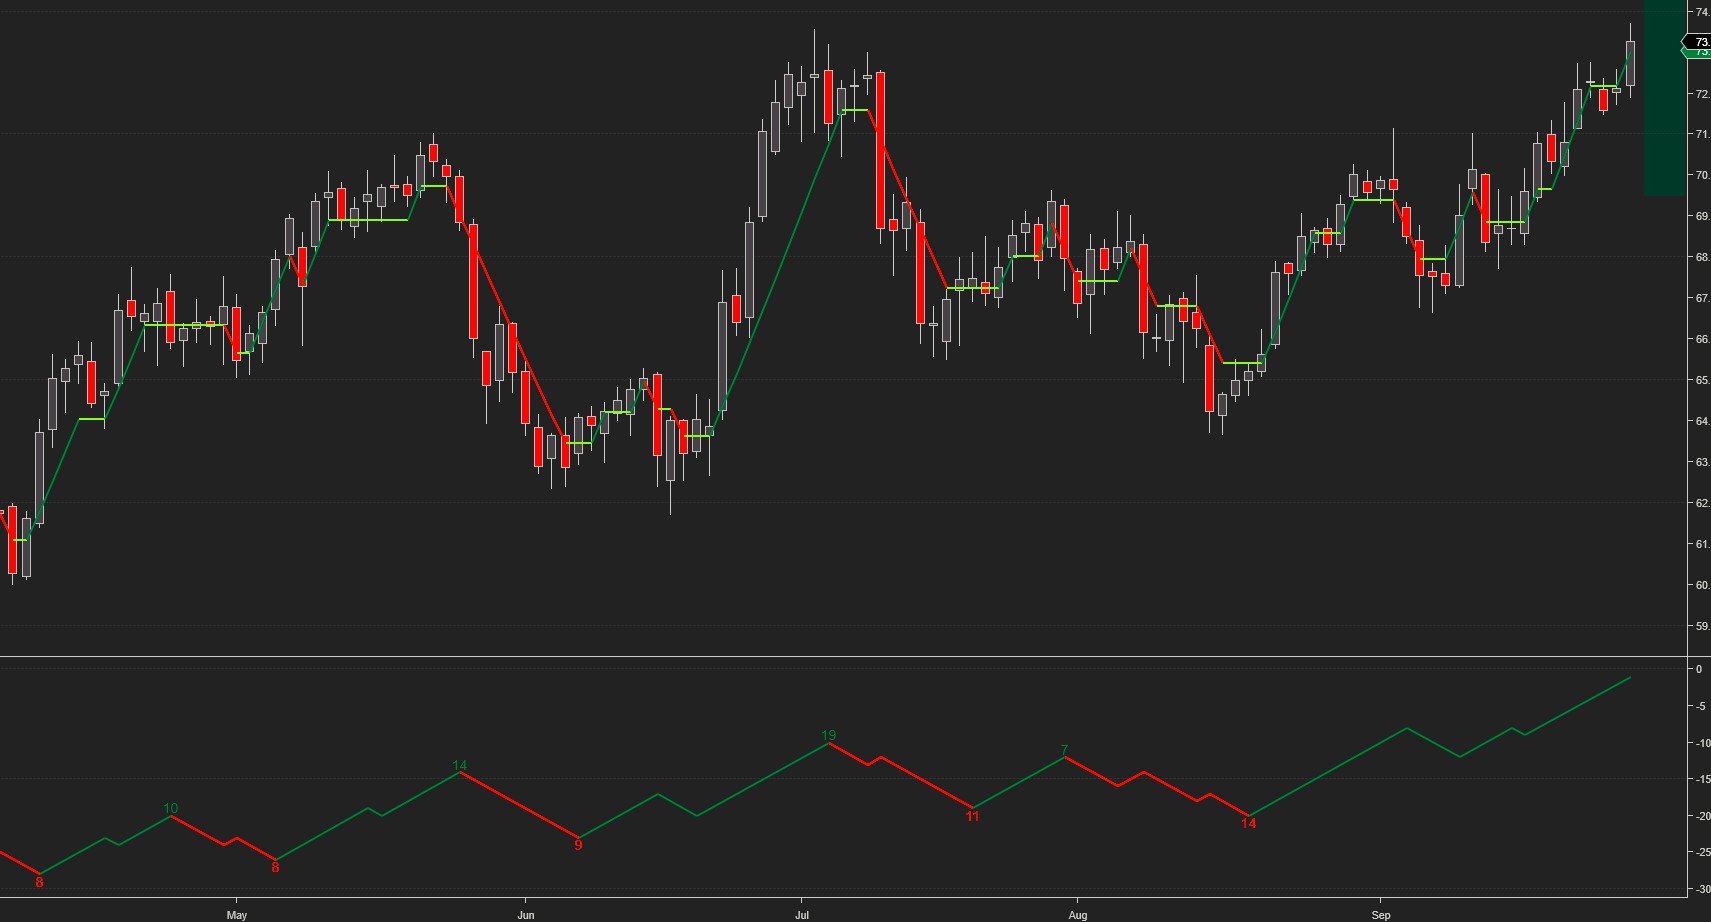
Oil hit our upside target on Friday and is closing in on the July highs.
The projected trading range for oil for next week is 69.5 – 74.5:
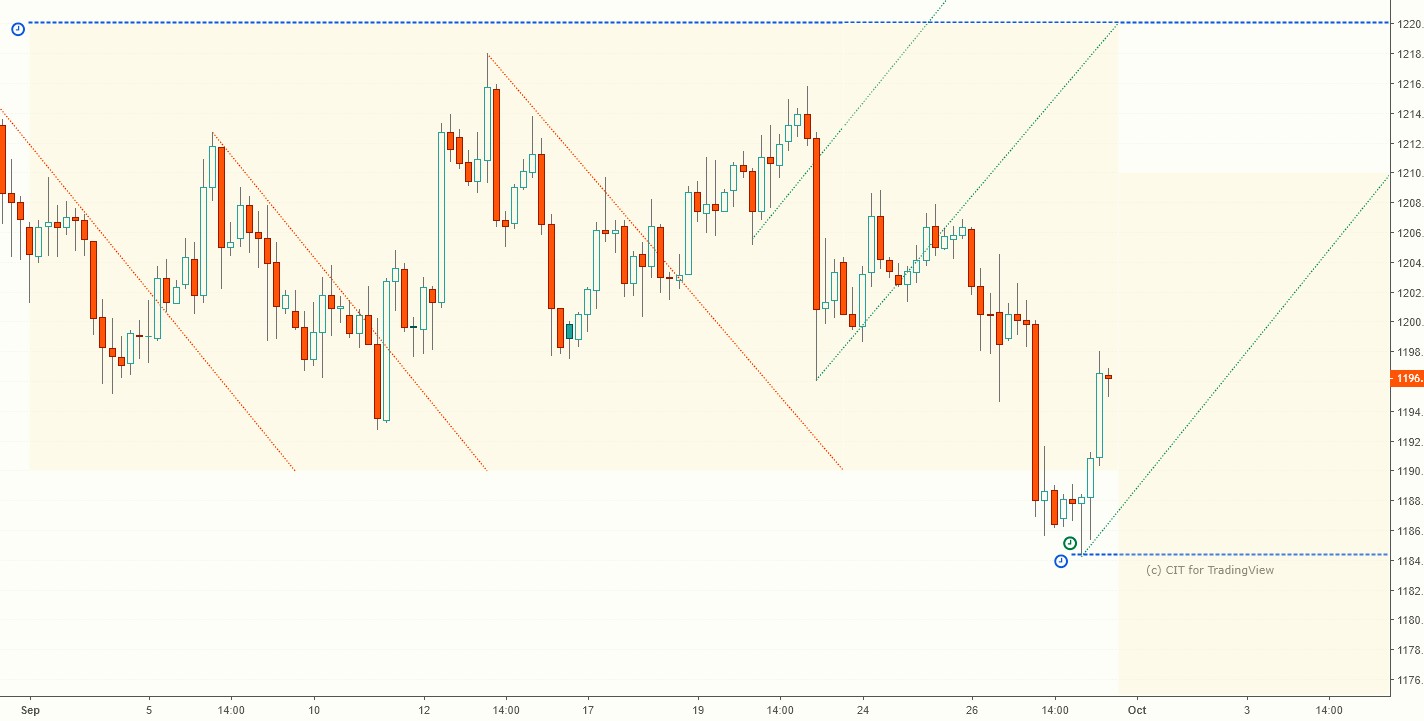
Gold tested our downside target twice on Thursday and Friday. It needs to break above 1220 for any sign of a meaningful bullish reversal.
The projected trading range for gold for next week is 1175 – 1210:
All G6 pairs, with the exception of AUDUSD, hit our targets.
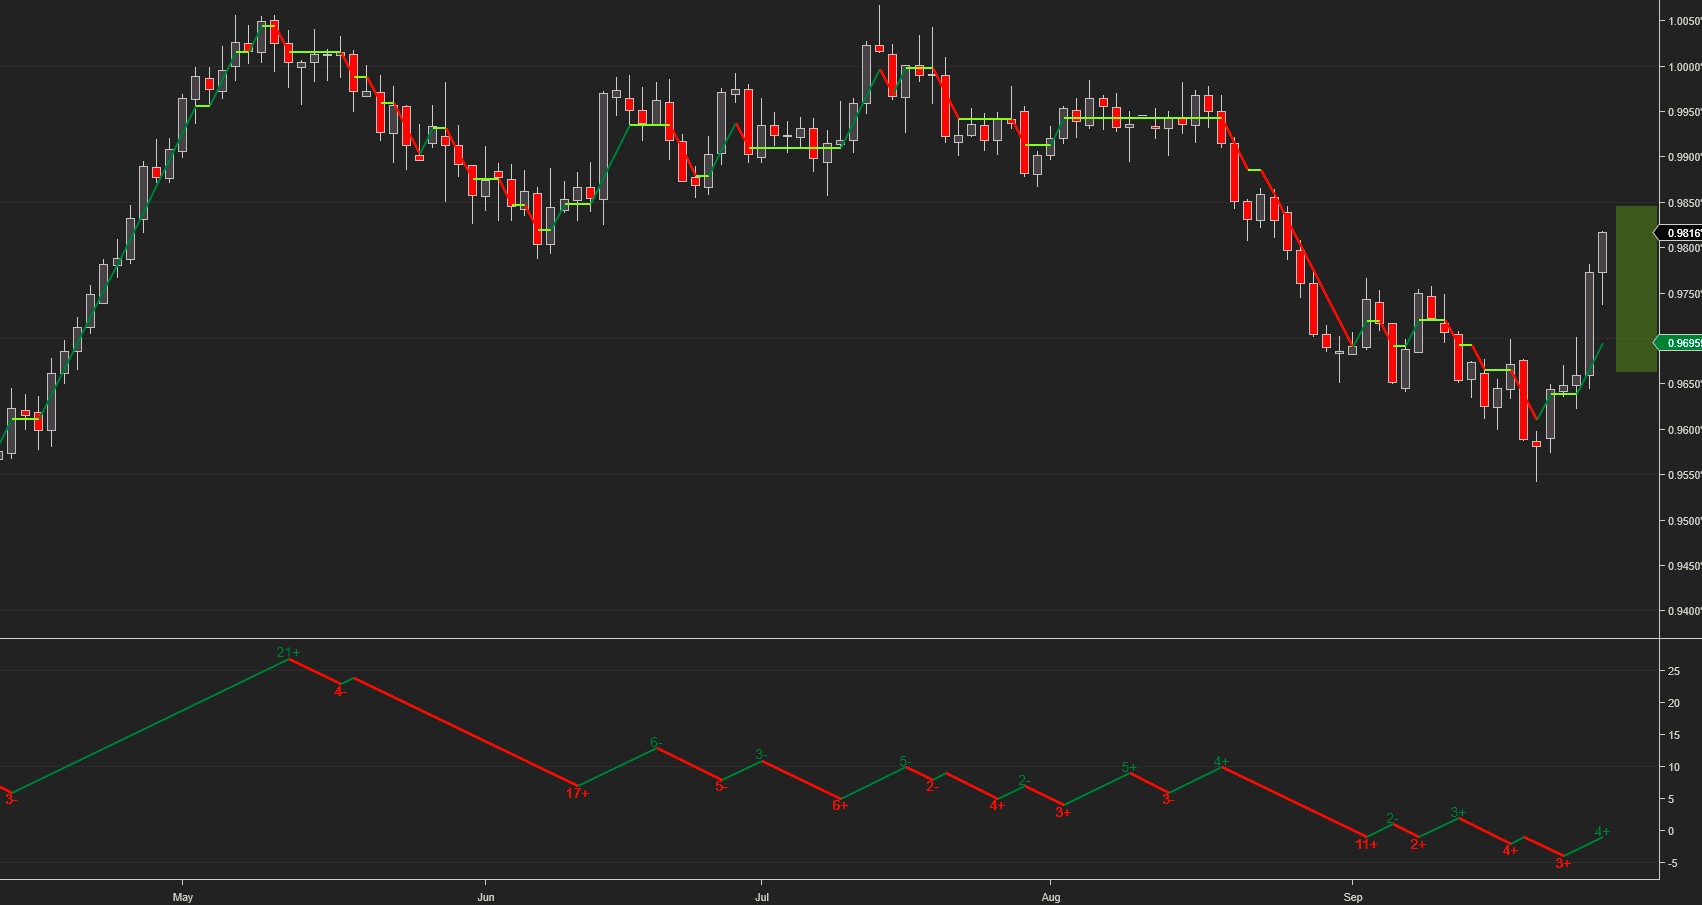
USDCHF finally found the bottom we were looking for just above the 0.618 retracement of the February – May rally, and staged a vigorous come-back. It broke above our upside target on Wednesday and never looked back. The next fib resistance level is at 0.986.
The projected trading range for USDCHF for next week is 0.966 – 0.985:
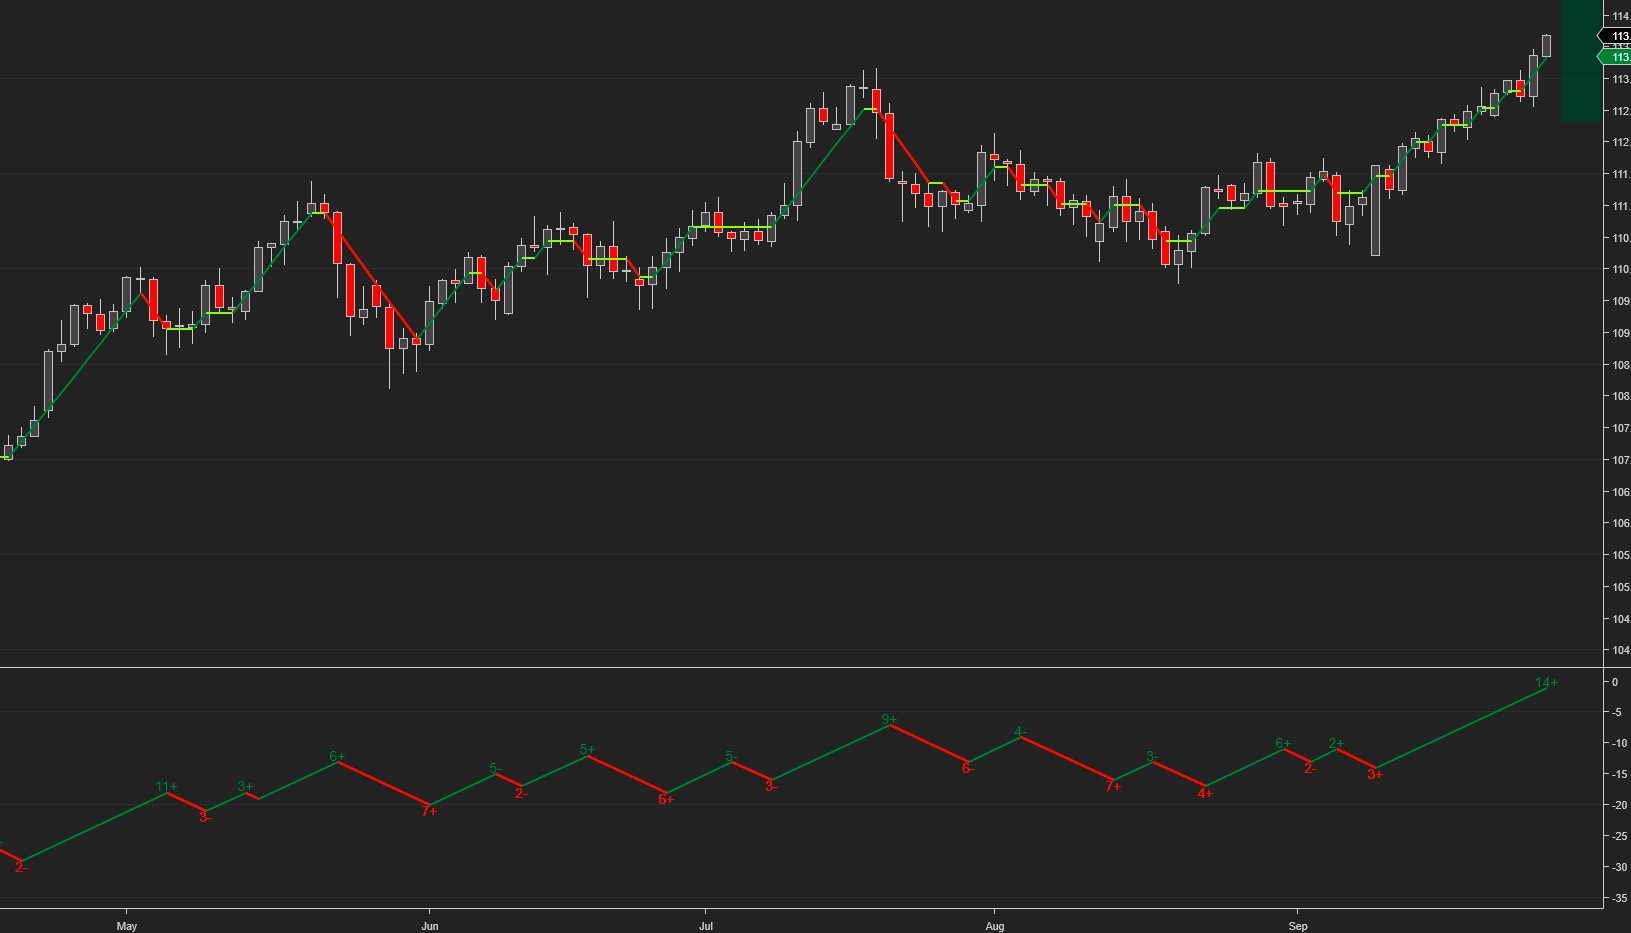
For the third week in a row, USDJPY reached our upside target on Thursday, retested it on Friday, and finished the week slightly higher.
The projected trading range for USDJPY for next week is 112.3 – 114.25:
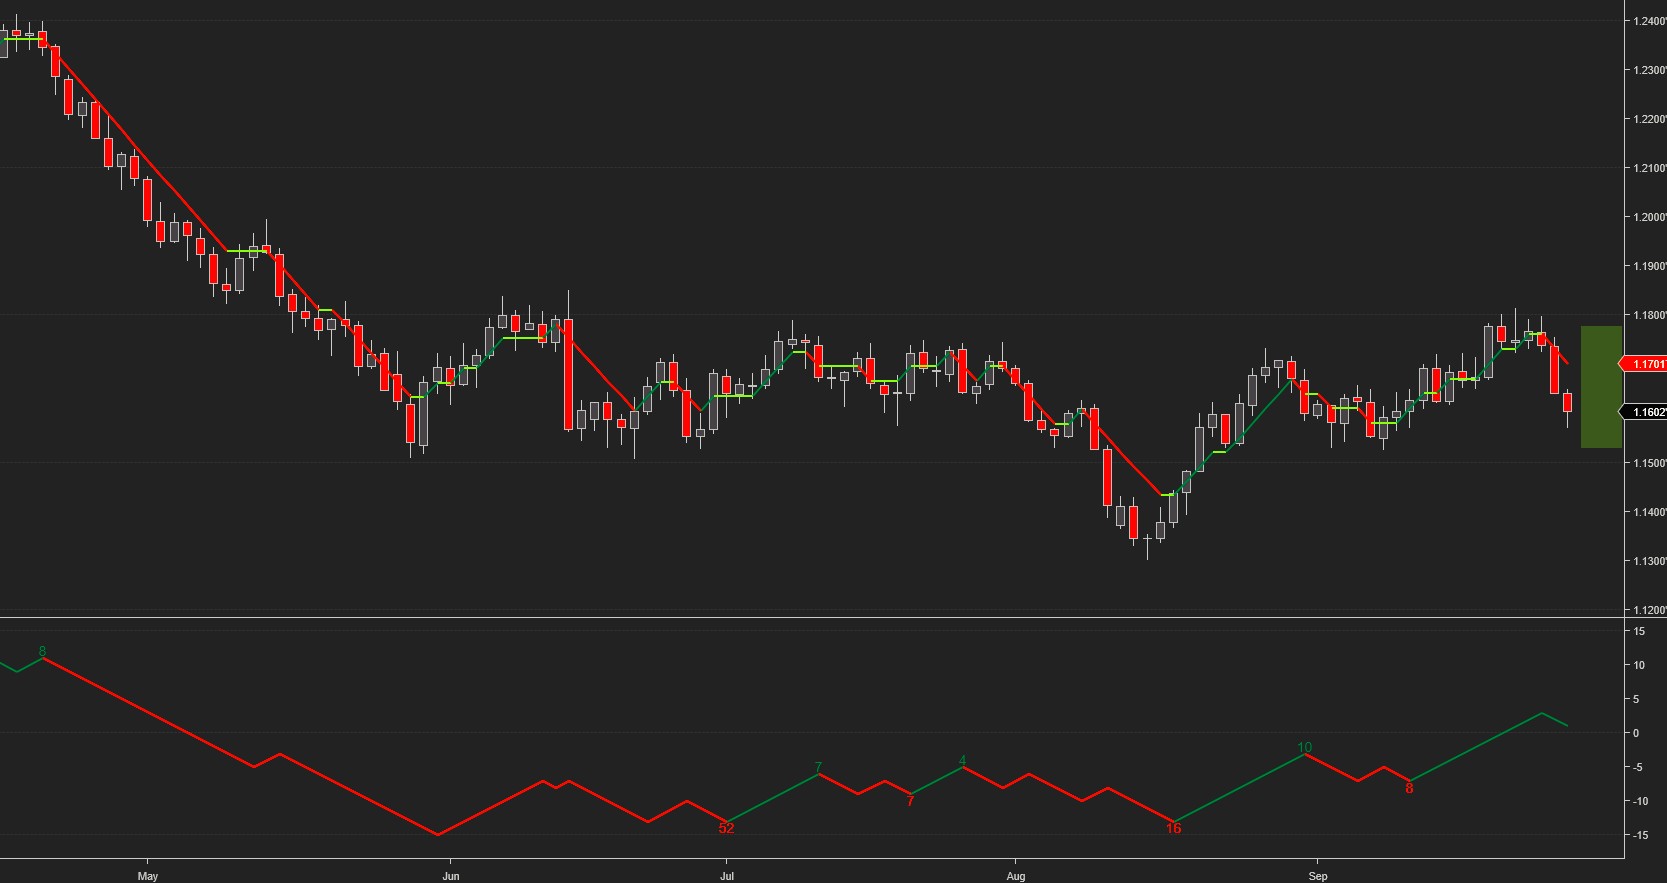
EURUSD came within a few pips of our upside target, but couldn’t hold onto the gains and reversed instead, finishing the week a few pips below our bearish target. The Euro needs to break above 1.82 against the USD for any signs of a meaningful bullish reversal.
Monthly pivot for EURUSD at 1.16, R1 – 1.1737, R2 – 1.1859
The projected trading range for EURUSD for next week is 1.153 – 1.18:
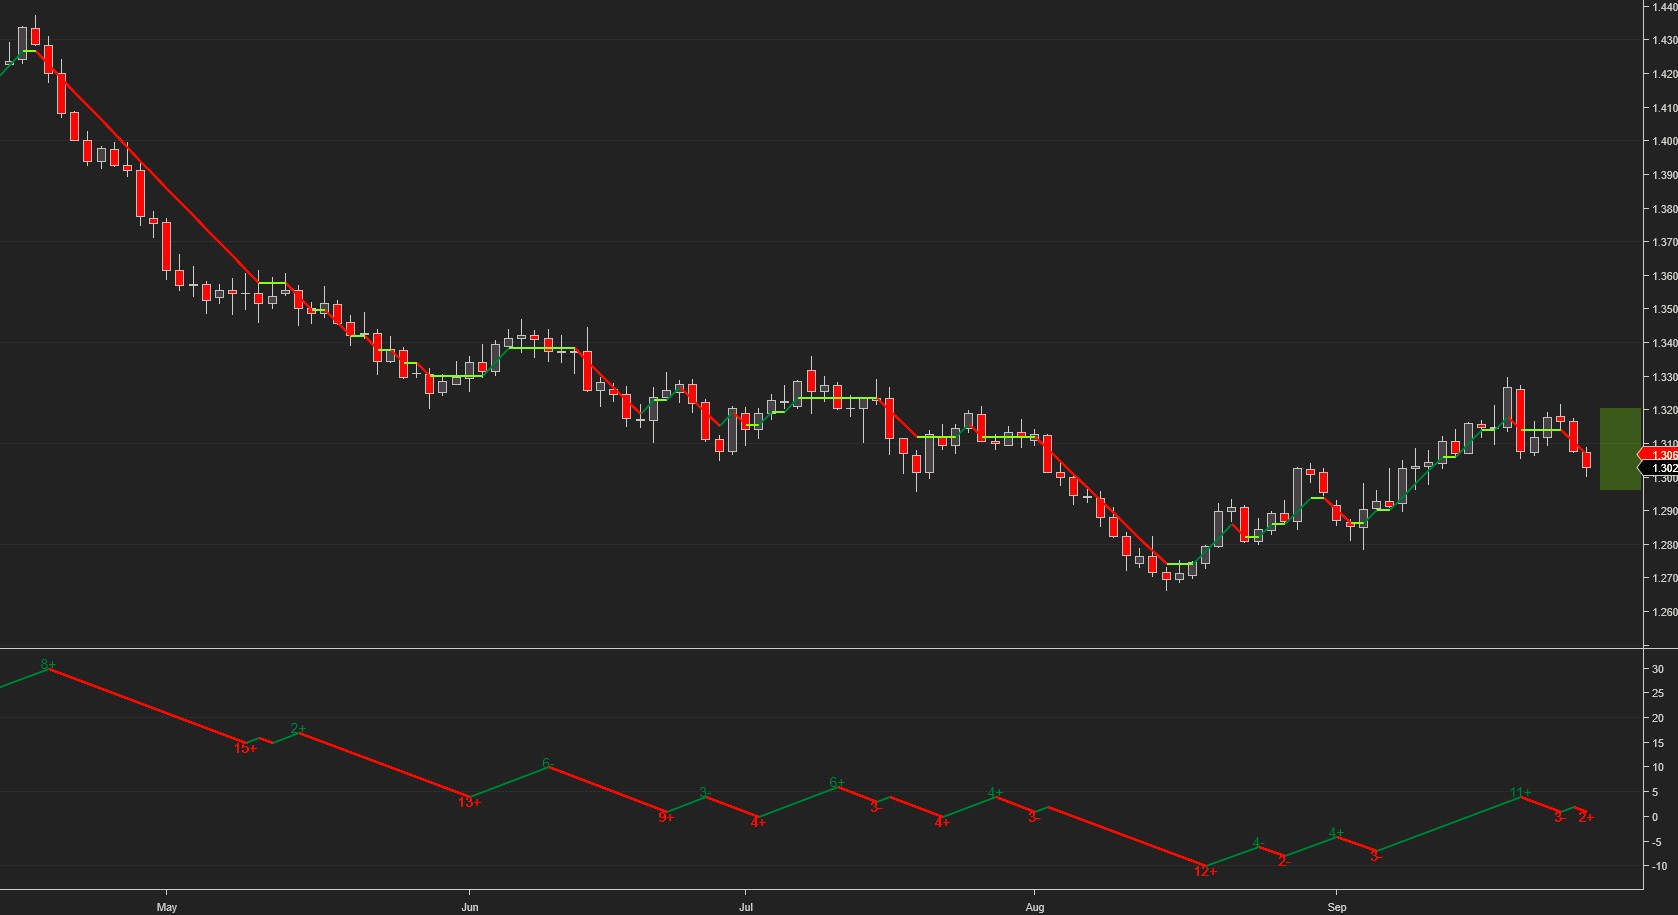
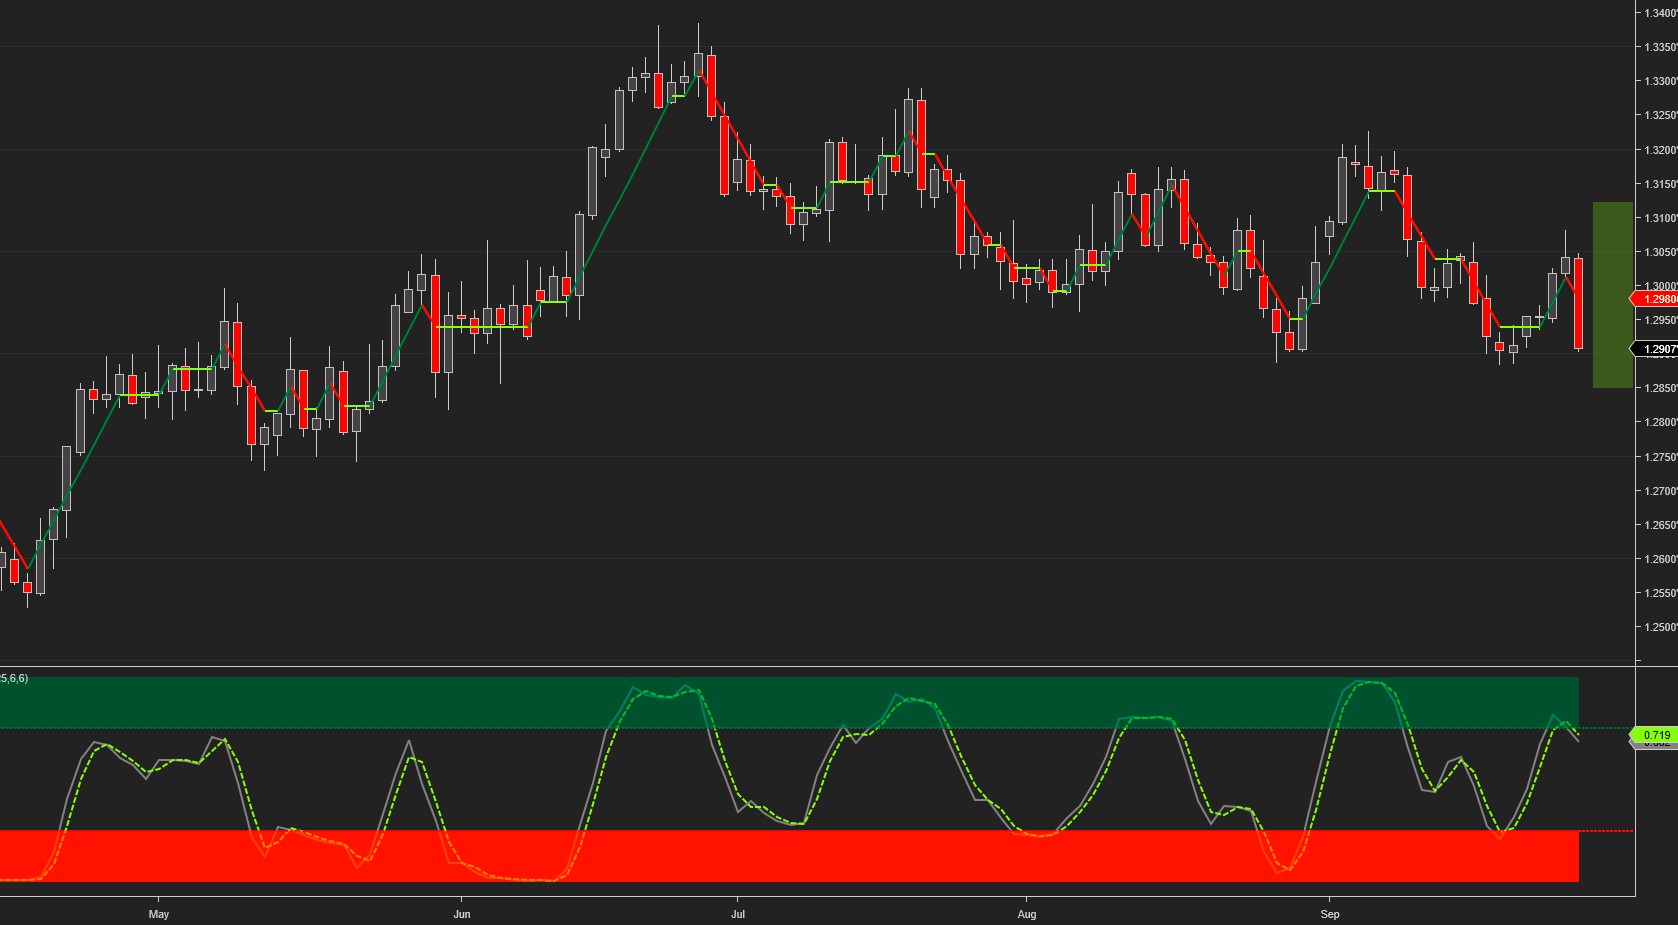
GBPUSD broke below the bullish angle mid-week and proceeded with a drop to our bearish target.
The monthly pivot line is at 1.29, R1 – 1.3253, S1 – 1.291.
The projected trading range for GBPUSD for next week is 1.298 – 1.32:
Last week we noted that recent USDCAD downswings have lasted on average 10 days. This proved to be the case again. After 10 down days USDCAD reversed up and reached our weekly upside target. The bullish reversal lasted only a day and USDCAD sold off, finishing the week with a small loss just a few pips above our downside target.
Monthly pivot at 1.307, S1 – 1.293, S2 – 1.280
The projected trading range for USDCAD for next week is 1.285 – 1.311:
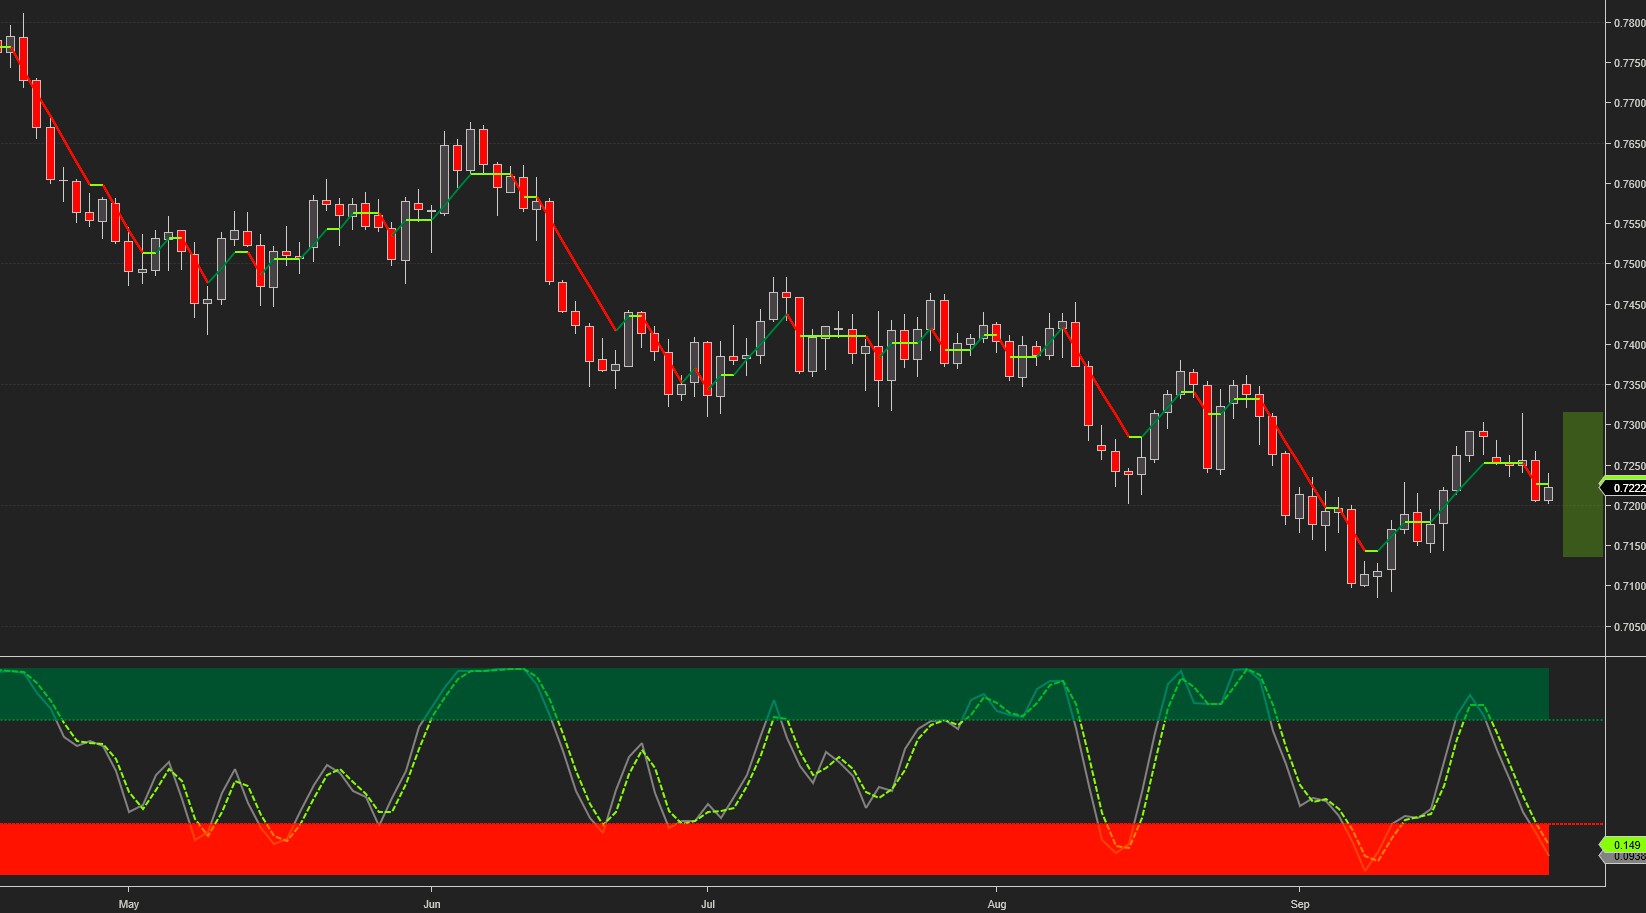
AUDUSD traded in a narrow range all week long, bouncing between weekly R1 and S1 pivot levels
Monthly pivot line at 0.7184, S1 – 0.7037, R1 – 0.72937, R2 – 0.73877
The projected trading range for AUDUSD for next week is 0.714 – 0.732:
Charts, signals and data courtesy of OddsTrader, CIT for TradingView and NinjaTrader 8
Disclaimer:Futures and forex trading contains substantial risk and is not for every investor. An investor could potentially lose all or more than the initial investment. Risk capital is money that ...
more


I am snowed by the jargon. Not your problem, but definitely mine. Sorry about that.